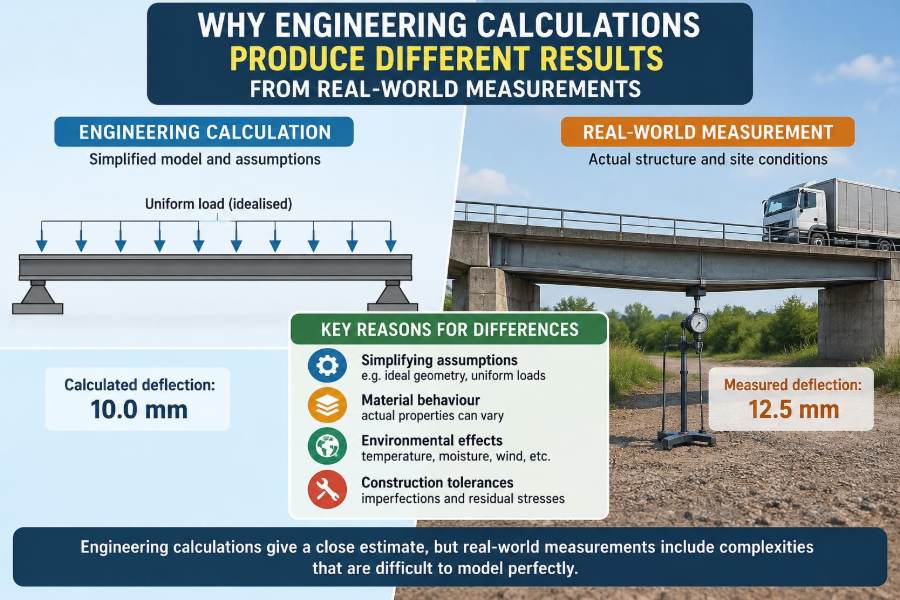

A beam is calculated to deflect 4.2 mm, but the dial gauge shows 5.1 mm. A pump curve predicts one flow rate, while the installed system delivers another. A temperature model says a component should be safe, yet a test reveals a hot spot.
These moments can feel like a contradiction: either the calculation must be wrong or the measurement must be wrong. In engineering, the more useful answer is usually that both are incomplete descriptions of the same physical system.
Calculations are built from models, assumptions, input data, and numerical methods. Measurements are built from instruments, procedures, environments, and interpretation. Each has uncertainty, and each observes reality through a different lens.
Understanding the gap between prediction and observation is central to good engineering. It helps engineers diagnose faults, improve designs, set sensible tolerances, and avoid treating a neat answer on a screen as the final truth.
🧭 A calculation is a model, not the physical object
An engineering calculation represents selected features of a real system using equations. It may model a bracket as a beam, a room as a well-mixed volume of air, or a motor as an ideal electrical circuit.
That simplification is not a flaw; it is what makes analysis possible. The question is whether the omitted features are small enough for the decision being made. A preliminary sizing calculation can tolerate more simplification than a safety-critical fatigue assessment.
🔍 Real systems contain more detail than equations
Reality includes surface roughness, local stresses, imperfect contacts, nonuniform temperature, manufacturing variation, operator behaviour, and changing surroundings. Many of these effects are too costly or impractical to include in an early model.
A model therefore has a scope: the conditions under which it should give useful answers. Trouble begins when a result is applied outside that scope, such as using a steady-state thermal calculation during rapid heating.
🧱 Assumptions create useful but limited answers
Most engineering formulas arrive with assumptions, sometimes stated explicitly and sometimes hidden in the derivation. The familiar beam-deflection equations, for example, commonly assume linear elastic material behaviour, small deflections, known support conditions, and an idealized load arrangement.
If a support slips slightly, a load is eccentric, or the beam yields locally, the formula may no longer describe the test. The arithmetic can be perfect while the physical assumptions are unsuitable.
📏 Material properties are not single permanent numbers
Tables list values such as Young’s modulus, thermal conductivity, density, and yield strength, but actual material properties vary. Composition, heat treatment, grain structure, moisture content, orientation, ageing, and temperature can all matter.
Even a correct datasheet value may represent a typical condition rather than the exact batch in a product. For polymers, rubber, timber, composites, and soils, variation can be especially substantial because their response depends strongly on history and environment.
🌡️ Temperature changes both parts and properties
Temperature affects dimensions through thermal expansion and can also alter stiffness, resistance, viscosity, strength, and chemical behaviour. A steel part that fits correctly in a cool workshop may bind after nearby equipment heats it.
Temperature gradients matter too. If one side of a plate is warmer than the other, it may bend even when its average temperature appears harmless. A model based only on one temperature value can miss this mechanism.
💧 Humidity, contamination, and ageing alter behaviour
Environmental effects are often slow, which makes them easy to overlook during short tests. Moisture can change the dimensions and stiffness of hygroscopic materials; corrosion can reduce section thickness; dust can obstruct heat transfer; lubricants can degrade or migrate.
A new prototype tested indoors is therefore not automatically representative of equipment that has operated outdoors for years. Engineering validation needs conditions that resemble the intended life, not merely the assembly bench.
🏭 Manufacturing variation changes the starting point
Drawings specify allowable ranges, not identical parts. Hole positions, wall thicknesses, weld profiles, surface finish, residual stress, and assembly preload all vary within tolerances.
Suppose a calculated clearance is only slightly larger than the nominal thermal expansion. A part made at one end of its size tolerance and a mating part made at the other can eliminate that clearance entirely. Nominal dimensions alone may predict an assembly that no actual worst-case assembly achieves.
🔩 Boundary conditions are rarely perfectly ideal
Boundary conditions describe how a model is held, loaded, connected, or exposed. They are among the most influential choices in structural, thermal, fluid, and electrical calculations.
A “fixed” support in a textbook cannot rotate or translate. A real bolted connection can slip microscopically, seats unevenly, and has finite stiffness. That added compliance often explains why a tested structure deflects more than its ideal calculation predicts.
⚙️ Joints, interfaces, and contact are difficult to model
Many products are assemblies rather than single solid pieces. Interfaces introduce friction, gaps, preload loss, contact resistance, backlash, and changing stiffness. These effects can dominate performance despite occupying little space in a drawing.
For example, a thermal model may predict excellent heat flow through two metal plates, yet a small air gap or uneven contact pressure can create a significant thermal resistance. The bulk material conductivity is not the whole heat path.
🌀 Loads are often uncertain and nonuniform
Design calculations frequently use a stated load, but real loads can vary in magnitude, location, direction, duration, and sequence. A person standing on a platform does not load every point equally; a vehicle crossing a bump produces dynamic forces rather than a calm static weight.
The load history matters when fatigue, creep, wear, or vibration is involved. Two components may experience the same maximum load but have very different lives because one sees occasional events and the other sees millions of cycles.
🌊 Dynamic effects make static predictions incomplete
A static calculation assumes forces change slowly enough that inertia can be ignored. In moving equipment, impacts, rotating imbalance, switching currents, pressure pulsations, and rapid valve closures can create transient peaks.
Natural frequency is particularly important. When repeated excitation occurs near a structure’s natural frequency, vibration can grow much larger than a static-force estimate suggests. This is not mysterious extra force; it is the system storing and exchanging energy.
🎵 Resonance depends on the whole installation
A motor tested on a rigid laboratory base may behave differently after installation on a flexible frame, floor, or piping system. The added masses and stiffnesses alter the combined system’s natural frequencies and damping.
Consequently, a component-level model may be correct but still fail to predict assembly-level vibration. Testing should include realistic mounting arrangements whenever vibration performance matters.
🌬️ Fluid flow includes losses that ideal formulas omit
Ideal fluid equations are valuable because they show the relationship between pressure, velocity, elevation, and energy. Real pipes and channels also have friction, fittings, entrances, bends, valves, roughness, leaks, and sometimes flow separation.
At high flow speeds, turbulence makes local losses more significant and harder to predict exactly. A flow calculation should identify which losses were included, which were estimated, and whether the assumed roughness and valve state match the installed system.
🔥 Heat transfer paths are more complex than they look
Heat moves by conduction, convection, and radiation, often at the same time. Convection coefficients depend on fluid motion, geometry, orientation, surface condition, and temperature difference, so they are commonly estimated rather than known precisely.
Radiation becomes more influential as temperatures rise and depends on surface emissivity. A shiny new surface and an oxidized service-aged surface can radiate heat differently. Treating every surface as identical can shift the predicted temperature appreciably.
⚡ Electrical models depend on parasitic effects
A basic circuit diagram may show only intended resistors, capacitors, inductors, and sources. Physical circuits also contain unwanted but real resistance, inductance, capacitance, contact resistance, leakage paths, and electromagnetic coupling.
At low frequency, these parasitic effects may be negligible. At high switching speeds or high frequencies, a short wire trace can behave as an important circuit element. The correct model complexity depends on the time scale of the signal.
🧮 Numerical methods introduce approximation error
Computer simulation is not exact simply because it uses many equations. Finite element analysis divides a shape into elements; computational fluid dynamics divides a flow region into cells; time simulations use discrete time steps.
Mesh density, element type, time-step size, solver settings, and convergence criteria affect the result. A model can appear detailed while still being numerically inadequate near sharp corners, contacts, shocks, or steep temperature gradients.
🕳️ Geometry idealization can hide local behaviour
Engineers often remove fillets, threads, weld details, holes, tiny gaps, and surface features to make a model manageable. This is reasonable when evaluating overall stiffness or broad temperature trends.
It is risky when the question concerns local stress, leakage, crack initiation, electrical arcing, or heat concentration. A small geometric feature can control failure even though it barely changes the total mass or global displacement.
📥 Input data can matter more than solver precision
There is little value in calculating to many decimal places with uncertain inputs. If a load, friction coefficient, heat-transfer coefficient, or material thickness is only approximately known, the output should be interpreted as a range.
Precision is not the same as accuracy. A result of 18.347 kN may look authoritative, but its meaningful uncertainty may be far larger than the final digits imply.
📊 Sensitivity analysis reveals what deserves attention
Sensitivity analysis asks how much an output changes when an input changes. If a small change in bolt preload causes a large change in joint slip, preload deserves careful control and measurement. If a wide change in paint thickness barely affects the output, it may not deserve early effort.
This approach prevents teams from treating every unknown as equally important. It also exposes fragile designs: designs that meet a requirement only under one narrow set of assumed values.
🎯 Measurements have uncertainty too
A measurement is an estimate, not a direct view of a perfectly known true value. Its uncertainty can arise from instrument resolution, calibration, repeatability, sensor location, mounting, electrical noise, operator technique, and data processing.
A caliper reading displayed to 0.01 mm does not automatically establish the measured feature to that certainty. The contact force, jaw alignment, temperature, burrs, and accessibility of the feature may limit the useful result.
🧰 Calibration establishes traceability, not perfection
Calibration compares an instrument against a reference with known uncertainty and documents the relationship. It helps detect bias and supports traceability: a defensible chain connecting a measurement to recognized reference standards.
However, calibration does not remove all test uncertainty. A calibrated pressure transducer can still give a misleading result if installed where pulsations, trapped air, temperature drift, or a blocked sensing line distort what it senses.
📍 Sensor placement can change the observed result
Where a sensor sits determines what it measures. A temperature sensor bonded near a heat source may read a much higher value than one on the opposite surface; a strain gauge placed away from a stress concentration may miss the peak strain.
Instruments also disturb systems. A probe can conduct heat away, a pressure tap can alter local flow, and a heavy accelerometer can shift the vibration of a lightweight structure. The measurement method must be part of the engineering model.
⏱️ Timing and sampling can miss the important event
Slow data logging can average away a brief impact, voltage spike, or pressure surge. Conversely, poor sampling choices can create aliasing, where a rapidly changing signal appears as a false lower-frequency pattern.
Tests need a sampling rate, trigger method, and record duration suited to the phenomenon. Measuring the average temperature every minute is sensible for some thermal processes, but not for diagnosing a millisecond-scale switching event.
🔁 Repeatability and reproducibility answer different questions
Repeatability asks whether the same setup, operator, instrument, and method obtain similar results. Reproducibility asks whether results remain similar when conditions such as operators, equipment, or locations change.
A test can be repeatable yet biased: it may deliver the same wrong answer every time because of a systematic setup error. Running repeated trials is useful, but it cannot by itself prove that a method represents the intended real condition.
🧪 Validation compares the right quantities
Validation should compare a calculation and a measurement that describe the same quantity under equivalent conditions. Comparing a model’s average temperature with a sensor’s local peak, or a static displacement with a vibration amplitude, creates a mismatch before any conclusion is possible.
A useful comparison records the configuration, geometry revision, material condition, load case, environmental state, instrument details, and processing method. Without this context, a “disagreement” may be impossible to diagnose later.
🧾 Error budgets make uncertainty visible
An error budget lists the main contributors to uncertainty or discrepancy and estimates their likely influence. It may include material variation, dimensional tolerances, assumed boundary conditions, instrument calibration, sensor placement, and numerical discretization.
The goal is not to claim that every contributor is known exactly. It is to make assumptions reviewable and to distinguish dominant sources from minor ones. This turns an argument over one result into an organized investigation.
| Source of difference | Typical clue | Useful response |
|---|---|---|
| Model assumption | Bias changes with operating condition | Review physics and boundary conditions |
| Input uncertainty | Prediction shifts strongly with plausible values | Measure or bound sensitive inputs |
| Manufacturing variation | Similar units behave differently | Inspect dimensions, materials, and assembly |
| Measurement issue | Results depend on method or sensor location | Check calibration and test procedure |
| Numerical limitation | Result changes with mesh or time step | Perform convergence checks |
🧩 Correlation is an iterative engineering process
Model correlation means improving agreement between prediction and observed behaviour while preserving physical meaning. It is not simply adjusting a constant until curves overlap.
A defensible process changes one justified feature at a time: verify the test, confirm inputs, inspect assumptions, refine important geometry or interfaces, then test again. If every parameter is freely adjusted, a model may fit one experiment but predict new situations poorly.
🚫 Common mistakes when results disagree
One common mistake is immediately blaming the instrument. Another is assuming simulation must be correct because it looks sophisticated. Both responses skip the investigation.
- Comparing nominal design data with an as-built test article.
- Ignoring unit conversions, sign conventions, and reference locations.
- Using a single measurement to represent a variable system.
- Reporting a point prediction without a credible range.
- Tuning a model to one test and calling it validated everywhere.
- Discarding inconvenient data without a documented technical reason.
🛠️ A practical workflow for investigating a mismatch
- Define the discrepancy precisely: what quantity differs, by how much, and under which conditions?
- Verify units, timestamps, coordinate directions, data filtering, and simple arithmetic.
- Confirm that the physical test article matches the modeled geometry, materials, and assembly state.
- Review boundary conditions, loads, environmental conditions, and sensor placement.
- Run sensitivity checks to identify the assumptions most capable of explaining the gap.
- Refine or remeasure only where the evidence indicates it is worthwhile.
- Document the revised model’s valid range and any remaining uncertainty.
This sequence begins with inexpensive, high-value checks before moving to complex simulation or redesign. Many apparent mysteries are found in the connection between the model and the test rather than deep inside either one.
⚖️ Engineering decisions need margins, not false certainty
Design margins, safety factors, tolerances, and conservative operating limits acknowledge that inputs and conditions vary. They are not substitutes for understanding, but they help account for uncertainty that cannot be eliminated economically.
Too little margin can create fragile performance. Excessive margin can add cost, weight, energy use, or material without addressing the true source of risk. Good engineering uses evidence to place margin where variability and consequences justify it.
🤝 Calculations and measurements are stronger together
Calculations can explore many scenarios quickly, reveal governing mechanisms, and guide design before a prototype exists. Measurements expose real assembly effects, operating conditions, and behaviours that were not fully represented in the model.
The most reliable work treats testing and analysis as complementary feedback loops. A test improves the model; an improved model makes the next test more focused and informative.
🧠 The core principle: explain the gap before correcting it
A difference between calculation and measurement is not automatically evidence of failure. It is evidence that at least one element of the model–test chain needs closer examination: the physical assumptions, the inputs, the manufactured article, the test conditions, the instrument, or the numerical method.
The right response is curiosity disciplined by evidence. Define what was predicted and observed, compare like with like, quantify uncertainty where possible, and investigate the factors that materially affect the decision.
Engineering calculations become trustworthy not when they match every measurement exactly, but when their assumptions, limits, and uncertainty are understood well enough to support a sound decision. That is how equations become reliable tools for the real world. 📐🔧📊