
An electric bus leaves its depot before dawn. Its battery pack passed routine checks, the dashboard reports a healthy state of charge, and every cell is operating within its intended voltage range. Yet a reliability engineer still asks a harder question: what is the chance that one weak component, an unusual temperature pattern, or repeated high-power charging will create a problem over the vehicle’s service life?
That question matters because batteries do not fail in one perfectly predictable way. They age at different rates, experience different loads, and operate in environments that change from minute to minute. Two apparently identical packs can therefore follow noticeably different paths.
In phones, medical devices, grid storage, electric vehicles, and industrial backup systems, a battery is more than an energy container. It is a system whose uncertainty must be measured, managed, and communicated.
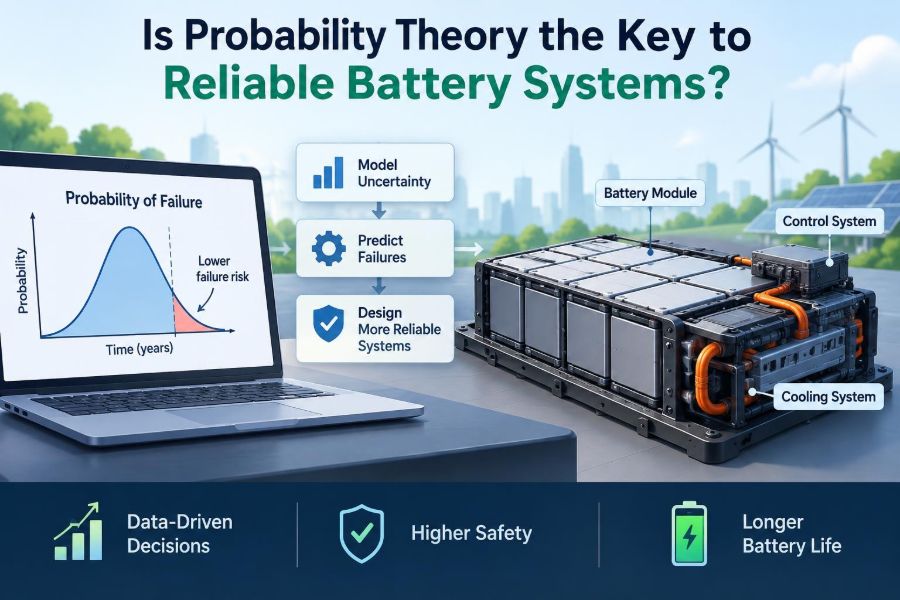
Probability theory provides a language for doing this. It cannot remove physical failure mechanisms, but it helps engineers turn variable evidence into better designs, safer operating limits, and defensible reliability decisions. ⚡
🔍 1. The reliability question behind every battery
Reliability is the probability that a system performs its required function for a specified time under stated conditions. Each part of that definition matters: required function may mean delivering power, retaining capacity, avoiding unsafe temperatures, or remaining available when called upon.
A battery cannot be described as simply “good” or “bad.” A pack might still run a low-power load while failing a high-power duty cycle, or retain capacity while its internal resistance has risen beyond an acceptable limit.
🎲 2. Why deterministic thinking is not enough
Deterministic models use fixed inputs and produce one result. They are valuable for estimating voltage, heat generation, and energy balance, but a single assumed value for every parameter can hide the spread that matters in real operation.
Cell capacity, contact resistance, ambient temperature, manufacturing variation, and user behaviour are not constants. Probability models represent them as quantities with distributions rather than pretending that an average unit tells the whole story.
📦 3. A battery pack is a population of components
A pack contains cells, interconnects, fuses, sensors, cooling hardware, contactors, insulation, enclosure parts, and battery-management software. The reliability of the whole depends on both individual items and their interactions.
Even cells from the same production batch differ slightly. A design must account for this population variation because the first limiting cell can constrain pack power, usable energy, or safety margins.
🧭 4. Defining failure before calculating it
Probability is only useful when the event of interest is clear. Engineers must define a failure criterion that is observable and relevant to the application.
- Capacity falls below the required usable-energy threshold.
- Internal resistance rises above a power-delivery limit.
- Voltage, temperature, or insulation leaves a permitted operating range.
- A protection device disconnects when service is required.
- A safety-related fault is detected.
Different criteria can lead to different reliability values for the same physical battery. That is not a contradiction; it reflects different required functions.
📊 5. Random variables describe real variation
A random variable assigns a numerical value to an uncertain outcome. Initial capacity, cycle life, time to a fault, daily energy throughput, and peak temperature can all be modelled this way.
For example, instead of saying a cell lasts 1,000 cycles, an engineer may describe cycle life as a distribution. This reveals not only a central value but also the likelihood of unusually early or unusually late degradation.
📈 6. Distributions are more informative than averages
The mean is useful, but it is rarely enough for reliability work. A pack designed around the mean may disappoint customers if the lower tail of the population reaches its performance limit much sooner.
Engineers select distributions based on data and physical reasoning. Normal distributions can be useful for some approximately symmetric measurements, while positive, skewed lifetime data may call for lognormal, Weibull, gamma, or other models.
| Measure | What it tells an engineer | Why it matters |
|---|---|---|
| Mean | Typical level | Supports nominal design calculations |
| Variance or spread | How much units differ | Indicates consistency and margin needs |
| Percentile | Value below or above a chosen fraction of units | Supports conservative performance targets |
| Tail probability | Chance of an extreme outcome | Focuses attention on rare but important events |
⏳ 7. Lifetime is a time-to-event problem
Many battery questions are naturally expressed as time-to-event questions: when will capacity cross a threshold, when will a cell imbalance trigger a limit, or when will a component fail to close?
If T is the time to a defined failure event, the reliability function is written as R(t) = P(T > t). It is the probability that the item survives beyond time t under the specified conditions.
🧮 8. Failure probability is the companion measure
The cumulative probability of failure by time t is F(t) = P(T ≤ t). For a simple binary definition of survival and failure, F(t) = 1 - R(t).
This distinction helps when translating engineering requirements. A mission may require a high survival probability over a short duration, while a warranty analysis may focus on the chance that a performance threshold is crossed during a longer period.
⚙️ 9. Hazard rate explains changing risk
The hazard rate describes the instantaneous tendency to fail at a given age, conditional on survival up to that point. It is not simply the same as the overall probability of failure.
Some components show elevated early-life risk due to latent defects. Others wear gradually, so their risk rises with age. Battery degradation can combine several mechanisms, making a constant-rate assumption convenient but often physically incomplete.
🛁 10. The bathtub curve is a useful caution
Engineers often use the bathtub curve as a conceptual picture: early failures, a relatively stable period, and wear-out. It can guide thinking about screening, monitoring, and replacement planning.
But it should not be applied mechanically. A battery pack’s observed failure pattern depends on chemistry, controls, thermal environment, service duty, maintenance, and the particular definition of failure.
🌡️ 11. Temperature turns uncertainty into ageing differences
Temperature influences electrochemical reaction rates, resistance, available power, and degradation pathways. It also varies across a pack because cooling is never perfectly uniform.
A probabilistic thermal model can combine variation in ambient conditions, heat generation, cooling effectiveness, and sensor error. The output is not merely one predicted temperature but a probability of reaching critical thermal conditions.
🚗 12. Duty cycles create unequal histories
Battery ageing depends on history. Fast charging, high discharge power, depth of discharge, time spent at high state of charge, rest periods, and temperature interact over thousands of operating events.
Two vehicles with the same mileage can have very different battery stress histories. Probability theory helps represent fleets as distributions of duty cycles instead of designing solely around one idealised route.
🔗 13. Dependence is one of the hardest issues
It is tempting to treat failures as independent. In a real pack, they often are not. A hot environment can stress many cells together, a manufacturing issue can affect a batch, and a cooling fault can create correlated temperature rises.
Ignoring dependence can produce overconfident reliability estimates. Common-cause failures are especially important because redundancy offers less protection when multiple components share the same stressor.
🧱 14. Series systems reveal the weakest link
In a simple series reliability model, every required component must function. If independent component reliabilities are R1, R2, ..., the system reliability is their product.
This is a useful first model for a safety chain or a power path, but engineers must check the assumptions. A battery pack may have graceful degradation, bypass paths, operating limits, and control logic that make its true structure more complex.
🛟 15. Redundancy helps only when designed carefully
Redundant temperature sensors, parallel sensing paths, or backup power paths can improve availability. Yet redundancy introduces its own wiring, diagnostics, software, and failure modes.
Its benefit depends on independence, fault detection, switching behaviour, and whether the backup is exposed to the same heat, vibration, contamination, or software defect as the primary component.
🧠 16. The battery-management system is part of reliability
A battery-management system estimates state of charge and state of health, monitors voltage and temperature, balances cells, and commands protective actions. It changes what the battery is allowed to do, so it belongs inside the reliability model.
An overly conservative estimate may reduce useful availability. An optimistic estimate may permit damaging operation. Reliability therefore involves both hardware uncertainty and uncertainty in algorithms, sensors, calibration, and diagnostic coverage.
📡 17. Sensor uncertainty must be propagated
Measurements are imperfect. Current sensors have offset and noise, voltage readings have finite resolution and calibration error, and temperature sensors may not represent the hottest internal location.
Uncertainty propagation asks how these input uncertainties affect a calculated output, such as state of charge, predicted range, or thermal margin. This is essential when a control decision is close to a safety or performance boundary.
🎯 18. Bayesian updating turns evidence into learning
Bayesian methods combine prior knowledge with new evidence. A prior distribution may reflect lab tests, material knowledge, or previous designs; field data then updates that belief.
This approach is particularly useful when early field populations are small. It makes assumptions explicit and allows learning to continue as returned packs, telemetry, inspections, and controlled tests provide more information.
🧪 19. Tests sample a process, not an entire future
Testing is indispensable, but no finite test programme reproduces every future user, climate, charge pattern, and manufacturing variation. The purpose of statistics is not to claim certainty from limited data.
Instead, engineers use samples to estimate parameters, compare designs, identify influential factors, and quantify uncertainty around conclusions. A test result should be interpreted with its sample size, representativeness, and censoring in mind.
🧫 20. Accelerated testing needs a physical bridge
Accelerated tests raise stress through temperature, cycling rate, voltage exposure, or mechanical conditions to obtain failures sooner. They are powerful when the accelerated mechanism remains relevant to service conditions.
The danger is assuming that more severe testing always means a simple scaling of normal ageing. Extreme stress can activate a different failure mechanism, so extrapolation needs electrochemical understanding as well as curve fitting.
✂️ 21. Censored data still contains information
In lifetime testing, some units have not failed when the test ends. These observations are right-censored: their lifetime is known to exceed the observation time, but the exact failure time is unknown.
Discarding them biases analysis toward shorter lifetimes. Survival-analysis methods incorporate both failures and censored observations, making better use of expensive and time-consuming battery tests.
🎰 22. Monte Carlo simulation explores many futures
Monte Carlo simulation repeatedly samples uncertain inputs and runs a model. Each run represents one plausible realisation of manufacturing variation, weather, usage, sensor error, or degradation parameters.
The collection of results estimates quantities such as probability of range shortfall, distribution of end-of-life capacity, or chance of exceeding a temperature limit. It is especially useful when equations become too nonlinear for a simple closed-form answer.
for each simulated battery:
  sample cell properties and duty cycle
  simulate electrical and thermal response
  update degradation over time
  record whether the failure criterion occurs
🗺️ 23. Sensitivity analysis identifies what deserves attention
A model can contain many uncertain inputs, but they do not contribute equally to the final risk. Sensitivity analysis asks which assumptions and variables most influence the output.
If ambient temperature dominates predicted ageing, better thermal data or cooling design may be more valuable than refining a minor resistance parameter. This prevents teams from spending effort on precision that does not change decisions.
📉 24. Confidence intervals and credible intervals are not guarantees
Statistical intervals express uncertainty in estimates. A confidence interval arises from a frequentist procedure, while a credible interval is interpreted within a Bayesian model and its prior assumptions.
Neither is a promise that a specific battery will behave within stated limits. Clear reporting should distinguish uncertainty in a model estimate from unit-to-unit variation and from unmodelled risks.
🧩 25. Fault trees organise failure logic
A fault tree starts with a top event, such as loss of required pack power or an unsafe thermal condition, and works downward through combinations of contributing events. AND and OR logic make assumptions visible.
For batteries, a top event may combine cell-level faults, sensor faults, cooling loss, contactor behaviour, control decisions, and external conditions. The tree is valuable even before exact probabilities are available because it exposes missing pathways.
🛡️ 26. Reliability and safety overlap, but differ
Reliability asks whether a required function is delivered. Safety asks whether unacceptable harm is prevented. A battery can be unreliable but safe when protection correctly limits power; it can also appear functional while operating with insufficient safety margin.
Probability supports both disciplines, but their event definitions, tolerable consequences, evidence requirements, and design responses may differ. Engineers should never replace safety analysis with a single reliability number.
🏭 27. Manufacturing variation is a design input
Process variation affects coating uniformity, electrolyte filling, weld quality, contact resistance, sealing, and calibration. Quality control reduces variation, while probabilistic design asks what residual variation means for product performance.
Design margin should not be used as an excuse for weak process control. The strongest approach combines capable manufacturing, traceability, screening where appropriate, and models that account for remaining uncertainty.
📬 28. Field data closes the modelling loop
Laboratory testing reveals mechanisms under controlled conditions; field data shows how products meet real users and environments. Both are needed because field data can reveal duty-cycle distributions and interactions that test plans did not anticipate.
Useful field analysis requires careful definitions, data quality checks, exposure information, and awareness of reporting bias. A pack that is rarely used has a different opportunity to fail than one operating every day.
🧾 29. Communicating risk is an engineering task
Decision-makers need results they can act on. “The model predicts 92% reliability” is incomplete unless it states the mission time, operating conditions, failure definition, data basis, uncertainty, and important assumptions.
A good reliability report separates what is measured from what is inferred. It also states what the model does not cover, allowing design, operations, service, and safety teams to make informed trade-offs.
🔋 30. The core principle: model uncertainty to design reliability
Probability theory is not the key by itself. Electrochemistry explains degradation, thermal engineering manages heat, electronics and software control operation, manufacturing creates consistency, and testing supplies evidence.
But probability connects these disciplines when outcomes vary. It turns questions such as “Will this battery last?” into structured questions about conditions, distributions, dependencies, thresholds, and acceptable risk.
Reliable battery systems are built not by assuming uncertainty away, but by measuring it, modelling it, and designing responsibly around it. 🔋📊⚙️