
A pump datasheet lists flow in litres per minute, while the pipe-sizing worksheet expects cubic metres per second. A colleague sends a load in pounds-force, but your calculation model uses newtons. None of these conversions is difficult on its own—until they appear repeatedly in a deadline-driven calculation.
That is where a small Excel calculator earns its place. Instead of searching for conversion factors, typing them again, and hoping a decimal has not moved, you can build a workbook that makes the conversion visible, repeatable, and easier to check.
The goal is not to replace engineering judgement with a spreadsheet. It is to create a reliable working tool: one that handles routine arithmetic consistently, exposes assumptions, and leaves you more attention for the physical problem behind the numbers.
This guide builds that tool from the ground up, then shows how to extend it into a practical library of engineering formulas without turning one workbook into an opaque tangle of cells.
🧭 Define What Your Calculator Must Do
Start with a narrow purpose. A useful first workbook might convert length, mass, force, pressure, temperature, flow rate, and energy, then calculate a few common quantities such as pipe velocity, stress, electrical power, or heat transfer.
Trying to support every engineering discipline on day one creates a long list of factors that is hard to verify. Build for calculations you actually perform, and add categories only when a real task requires them.
Write down the input units, output units, expected range, and formula for each calculation. This short specification is the calculator’s first defence against hidden assumptions.
📁 Plan a Workbook That Can Grow
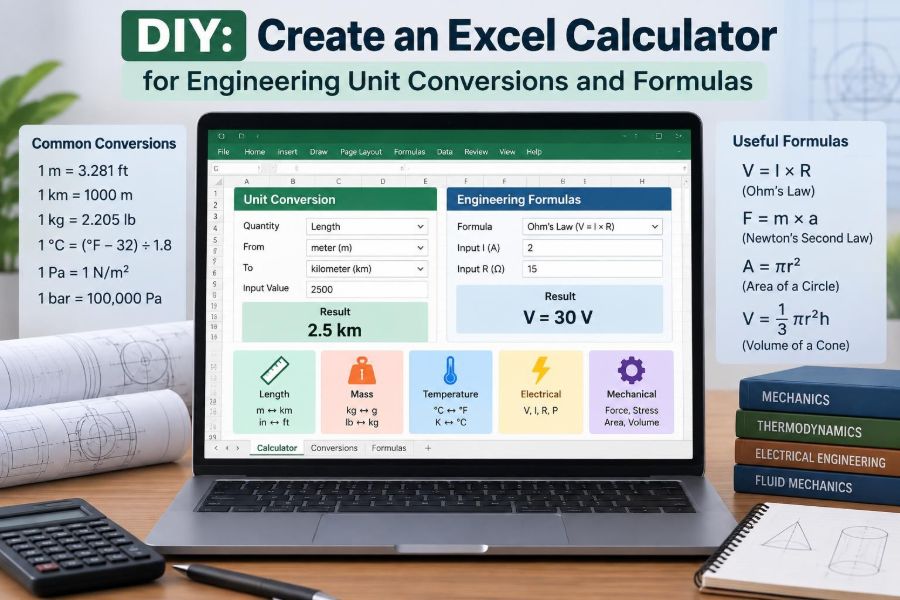
Separate the workbook into sheets with clear jobs. A simple structure is easier to maintain than one dashboard containing conversion tables, user inputs, and intermediate formula steps mixed together.
- Start Here: instructions, version, scope, and key assumptions.
- Converter: the user-facing unit conversion calculator.
- Formula Tools: focused engineering calculation blocks.
- Unit Data: conversion factors, symbols, and categories.
- Tests: known cases used to check the workbook after changes.
Protecting or hiding the data sheet can be sensible after validation, but do not make it inaccessible to the people responsible for maintaining it.
📏 Choose a Base Unit for Every Quantity
The cleanest conversion method uses a base unit for each physical quantity. For example, use metres for length, pascals for pressure, kilograms for mass, seconds for time, and kelvin for absolute temperature.
Every compatible input is first converted to the base unit. The base value is then converted to the requested output unit. This avoids writing a separate formula for every possible pair, such as inches-to-metres, feet-to-millimetres, and yards-to-centimetres.
For multiplicative conversions, the structure is simple:
Base value = Input value × Input factor
Output value = Base value ÷ Output factor
The factor is the number of base units represented by one selected unit. One millimetre, for instance, represents 0.001 metres.
🔢 Build a Clean Unit Data Table
On the Unit Data sheet, create one row for each unit. Convert the range to an Excel Table so formulas expand automatically when you add rows.
| Category | Unit name | Symbol | Factor to base | Offset |
|---|---|---|---|---|
| Length | millimetre | mm | 0.001 | 0 |
| Pressure | bar | bar | 100000 | 0 |
| Force | pound-force | lbf | 4.448221615 | 0 |
Use unambiguous names. A unit symbol such as ton is not precise enough by itself because its meaning varies by context. Label the exact convention used, such as metric tonne or US short ton.
🏷️ Use Named Tables and Readable Labels
Name your Excel Table something meaningful, such as UnitTable. Name key input cells too: InputValue, FromUnit, and ToUnit are easier to audit than references such as B7 and F12.
Readable names make formulas resemble the calculation they represent. They also reduce mistakes when a layout changes later. This is not merely cosmetic; it improves review and troubleshooting.
🔎 Retrieve Conversion Factors Reliably
Modern Excel versions can use XLOOKUP to retrieve factors from the unit table. If unit symbols are unique across the entire workbook, a direct lookup is enough:
=XLOOKUP(FromUnit,UnitTable[Symbol],UnitTable[Factor to base])In larger tools, symbols may repeat or appear confusingly similar. A safer design creates a unique key by joining category and symbol, such as Pressure|bar. Look up that key rather than relying on the symbol alone.
Older workbooks can use INDEX and MATCH. The principle matters more than the particular Excel function: retrieve data from one controlled source, rather than embedding factors in many separate formulas.
🔁 Apply the Two-Step Conversion Formula
Suppose an input of 250 mm must be shown in inches. If your factor-to-base values are metres per unit, then millimetres use 0.001 and inches use 0.0254.
=InputValue * FromFactor / ToFactorThe calculation becomes 250 × 0.001 ÷ 0.0254, giving approximately 9.8425 inches. The formula remains identical for any ordinary multiplicative unit conversion in the same category.
Do not permit a length input to be converted to pressure simply because both appear in a dropdown. The category check is as necessary as the arithmetic.
🌡️ Treat Temperature as a Special Case
Temperature scales such as Celsius and Fahrenheit do not share a common zero, so multiplying by a factor alone is wrong. Celsius is related to kelvin through an offset, while Fahrenheit requires both scaling and an offset.
A general linear conversion can be represented as:
Base value = (Input value + Input offset) × Input factor
Output value = (Base value ÷ Output factor) - Output offset
For an absolute-temperature base in kelvin, Celsius has factor 1 and offset 273.15. Fahrenheit has factor 5/9 and offset 459.67 when using the expression above. Test these carefully; temperature is where a seemingly elegant generic formula can conceal a sign error.
⚠️ Separate Temperature Differences from Temperatures
A temperature difference of 10 °C equals a difference of 10 K. It does not equal 10 °F; the corresponding difference is 18 °F. Offsets do not apply to differences.
This matters in heat-transfer calculations, where a driving temperature difference is often used rather than an absolute temperature. Create a separate category such as “Temperature difference” with scale factors only. Do not reuse your absolute-temperature conversion logic for it.
🧮 Keep Units Dimensionally Compatible
Dimensional analysis checks whether the physical dimensions of an equation make sense. Velocity has dimensions of length divided by time. Pressure has dimensions of force divided by area. Adding a pressure to a velocity is physically meaningless, regardless of what Excel allows.
At a minimum, require the From and To unit lists to come from the same category. For formula tools, display the required units beside every input. This catches many errors before a number reaches a report.
📋 Create Dropdown Lists That Prevent Bad Inputs
Use Excel Data Validation to create dropdown lists for category, input unit, and output unit. Free-typed unit labels invite spelling variations such as “meters,” “metres,” “m,” and “M,” each of which may behave differently in a lookup.
A practical flow is to select a category first, then offer only units within that category. Dynamic-array functions such as FILTER can generate the filtered list in current Excel versions. In older versions, helper ranges or named formulas can provide the same control.
Dropdowns are not a substitute for knowledge, but they turn many preventable entry errors into impossible entries.
🧱 Design Inputs, Outputs, and Assumptions Differently
A user should be able to see immediately which cells they may edit. Use one consistent style for input cells, another for calculated cells, and a third for warnings or notes.
Place units beside values rather than burying them in a header. A row labelled “Pipe internal diameter” with an adjacent value and visible unit is clearer than a lone number beneath a distant column title.
Include a short assumptions block for each formula tool. It might state “steady incompressible flow,” “uniform circular pipe bore,” or “values are gauge pressure.” These statements define where the result is meaningful.
🛑 Handle Blank Cells and Errors Deliberately
A blank input should not produce a misleading zero result. Use a conditional formula that leaves the output blank until required values are present.
=IF(OR(InputValue="",FromUnit="",ToUnit=""),"",InputValue*FromFactor/ToFactor)Use IFERROR sparingly. It can improve a user-facing message, but wrapping every formula in IFERROR(...,"") can hide broken references and incorrect lookups. During development, visible errors are valuable clues.
🧪 Test with Values You Can Verify by Inspection
A calculator should be tested before it is trusted. Start with simple cases that have obvious answers: 1 m = 1000 mm, 1 kPa = 1000 Pa, and 0 °C = 32 °F.
Then use reverse tests. Convert 12 inches to millimetres and convert the result back to inches. A small difference may occur because of display rounding, but the unrounded underlying values should return closely to the starting number.
- Test a zero value where it is physically valid.
- Test negative values for temperature and signed quantities.
- Test very small and very large values.
- Test invalid category combinations and missing selections.
🎯 Distinguish Display Rounding from Calculation Precision
Excel can display 2 decimal places while retaining a more precise value underneath. This is usually desirable: round only when reporting a final answer, not at every intermediate stage.
A common mistake is using the ROUND function throughout a calculation chain because the displayed figures look neater. Repeated rounding can accumulate and affect a final result, especially where several terms are added or subtracted.
Use cell formatting for appearance. Use ROUND only when a documented reporting rule or practical resolution requires it.
🔬 Add Significant-Figure Awareness
Decimal places are not the same as significant figures. A measurement of 2.0 mm communicates different precision from 2.000 mm, even though both can be displayed with decimals.
Excel does not automatically understand measurement uncertainty. Your calculator can, however, encourage sensible reporting by showing a full-precision result and a separately rounded report value. If precision affects a decision, record the measurement source and tolerance outside the final rounded cell.
💨 Build a Pipe-Flow Velocity Tool
A useful first formula tool calculates average velocity in a circular pipe. For volumetric flow rate Q and internal diameter D, cross-sectional area is πD²/4, so velocity is:
v = Q / (πD²/4)Convert flow to m³/s and diameter to m before using the formula. For example, a flow rate entered in L/min and a diameter entered in mm can both be converted silently to base units, while the user still sees the units they selected.
This result is an average velocity. Actual velocity varies across the pipe cross-section, particularly in laminar flow, so do not interpret it as the speed at every point.
🧱 Build a Stress and Force Tool
Normal stress is force divided by area:
σ = F / AWhen force is in newtons and area is in square metres, the result is pascals. Engineering reports commonly use megapascals, so convert the final result deliberately rather than assuming a displayed number is already in MPa.
The formula is simple, but the model assumptions are not always simple. Ask whether the load is axial, whether the area is gross or net section, and whether stress concentration, bending, or buckling needs a more appropriate method.
⚡ Build an Electrical Power Tool
For a basic DC relationship, electrical power is voltage times current:
P = V × IThis is an excellent calculator block because it reinforces units: volts multiplied by amperes give watts. It is also a reminder that formula labels need context. AC systems may require power factor, phase information, or a different relationship depending on the system arrangement.
Keep the first block explicit: “DC electrical power” is more useful and safer than a generic label simply called “Power.”
🔥 Build a Sensible Heat-Rate Tool
For a flowing fluid with approximately constant specific heat capacity over the working range, a simplified sensible heat-rate estimate is:
Q̇ = ṁ × cp × ΔTHere, ṁ is mass flow rate, cp is specific heat capacity, and ΔT is temperature difference. If units are kg/s, J/(kg·K), and K, the result is watts.
Make the simplification visible. Specific heat can vary with temperature and material, phase changes require additional treatment, and a flow reading may be volumetric rather than mass-based. The spreadsheet should not imply certainty beyond the model.
🧾 Record Formula Sources and Assumptions
Every formula block should state its equation, variable definitions, required units, and applicability. This lets another engineer review the calculation without reverse-engineering a long Excel expression.
A compact note might say: “Applies to steady flow through a full circular pipe; diameter is internal diameter; output is area-averaged velocity.” If a factor comes from a project specification or supplier document, identify that document in a note rather than embedding an unexplained number.
🔒 Protect Formulas Without Blocking Review
Lock formula cells and protect the sheet to prevent accidental overwriting. Leave input cells unlocked, and use clear formatting so users do not need to guess where to type.
Protection is an operational safeguard, not a guarantee of correctness. A protected wrong formula is still wrong. Keep an editable controlled master copy, document who owns it, and use a revision label visible on the Start Here sheet.
🗂️ Use Version Control Appropriate to the Risk
For a personal learning tool, a dated filename and a change log may be sufficient. For work that influences design, purchasing, test decisions, or safety-related records, follow your organisation’s document-control process.
At a minimum, record what changed, why it changed, who checked it, and which version produced a reported result. This makes later review possible when a conversion factor or formula is updated.
👀 Make Results Easy to Review
A good calculator does not merely show one final number. It reveals enough of the path to let a reviewer check it quickly: input value and unit, converted base value, equation used, output value and unit, and important assumptions.
For high-consequence calculations, consider showing an “audit line” in plain language, such as: “25 L/min = 0.0004167 m³/s.” This can expose a unit-selection error immediately.
🚫 Avoid Hard-Coded Numbers in Formulas
A formula such as =B5*0.001/0.0254 can be mathematically correct, but it gives a reviewer no indication of where the factors came from. Repeated hard-coded numbers are especially risky when a convention changes or an error is found.
Store factors in the Unit Data table and retrieve them by lookup. Constants such as gravitational acceleration, gas constants, or material properties deserve the same treatment: a labelled data cell with units and a note on its intended use.
🧩 Know When Excel Is Not the Right Tool
Excel is strong for transparent, bounded calculations and routine data handling. It is less suitable for models requiring complex iterative solving, rigorous traceability across many users, live safety interlocks, or specialised numerical methods unless supported by appropriate controls and review.
Do not use a homemade worksheet as the only authority for a regulated, safety-critical, or contractually governed calculation without the validation and approval process required in that setting. A calculator’s convenience never changes its engineering responsibility.
📤 Export Results Without Losing Context
When copying results into a report, include the unit and sensible precision. A bare value such as “4.2” is almost useless; “4.2 MPa” is interpretable, while “4.2 MPa, calculated from 21 kN over 5000 mm²” is reviewable.
For recurring work, create a print-friendly summary area containing inputs, outputs, assumptions, workbook version, and calculation date. This preserves context even if the original workbook changes later.
🧠 Turn Errors into Design Improvements
If users repeatedly choose the wrong pressure convention, rename the choices more clearly. If they confuse internal and external diameter, add a diagram-free note beside the input. If they enter a flow rate in the wrong unit, make the unit selection mandatory and conspicuous.
The best spreadsheet improvements come from observing how it is actually used. Rather than blaming the user, adjust the layout or validation so the safer action becomes the easier action.
✅ Use a Pre-Release Checklist
Before sharing a workbook, make a final pass that checks both engineering logic and spreadsheet behaviour.
- Are all input and output units visible?
- Do conversion factors refer to a defined base unit?
- Are temperature and temperature-difference conversions separated?
- Do dropdowns prevent incompatible unit categories?
- Have known-value and reverse-conversion tests passed?
- Are formulas protected while intended inputs remain editable?
- Are scope, assumptions, version, and ownership stated?
A checklist does not prove a model is suitable for every use. It does create a repeatable review habit, which is far better than relying on memory when work is busy.
🏁 The Core Principle: Make Every Number Traceable
A dependable engineering calculator is not defined by colourful formatting or a large catalogue of formulas. It is defined by traceability: every input has a unit, every factor has a source and meaning, every formula has stated assumptions, and every output can be checked.
Build conversion logic around base units, isolate special cases such as temperature, validate inputs, and test with known values. Then add formula tools gradually, keeping each one small enough that its physical meaning remains clear.
The spreadsheet should support judgement, not hide it. When a result looks surprising, the workbook ought to help you ask the right questions: Are the units compatible? Is the input plausible? Does the equation fit the physical situation?
A well-designed Excel calculator turns routine conversion work into a transparent engineering process—consistent enough to reuse and clear enough to challenge. 📐🔧✅