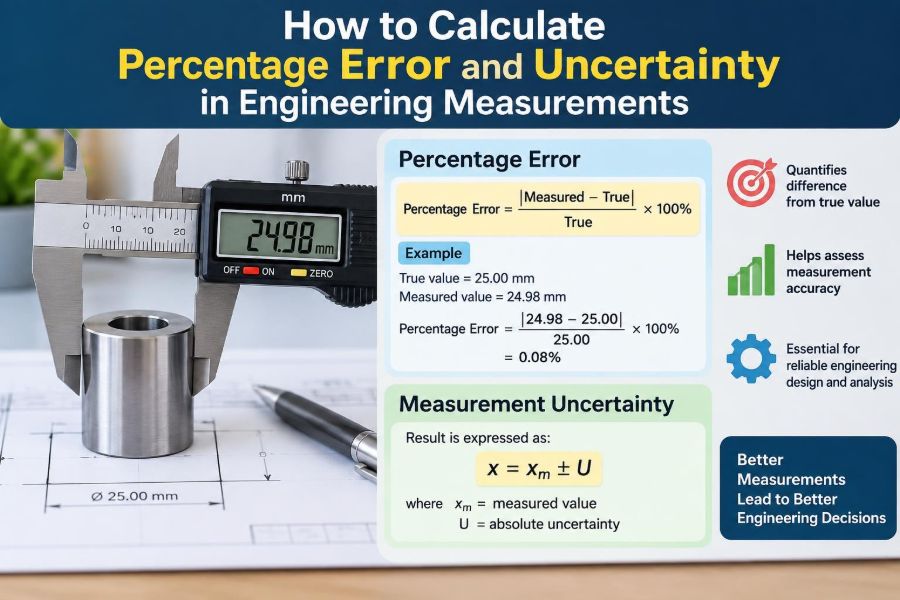

A shaft is measured as 24.98 mm when its design drawing calls for 25.00 mm. Is the part acceptable? The difference is only 0.02 mm, but the answer depends on the drawing tolerance, the instrument, the measurement method, and the consequence of getting it wrong.
Similar questions appear in laboratory reports, calibration records, site surveys, manufacturing inspections, and sensor dashboards. A number without its measurement quality can look more certain than it really is.
Percentage error and uncertainty give engineers a disciplined way to describe that quality. They help separate a real change in a system from normal measurement variation, and they make calculations comparable across very different scales.
The arithmetic is straightforward. The judgement behind choosing the right reference value, uncertainty model, and reporting format is where engineering care matters.
📏 What a Measurement Really Represents
A measurement is an estimate of a physical quantity made with a method and instrument. Writing 12.4 V means more than stating a number: it implies a unit, a resolution, conditions, and an expected range of doubt.
No practical measurement is perfectly exact. Temperature, alignment, operator technique, instrument calibration, electrical noise, and the object itself can all influence the result.
🎯 Accuracy, Precision, and Error
Accuracy describes closeness to a reference or accepted value. Precision describes how closely repeated readings agree with one another.
A digital balance can repeatedly report nearly the same mass yet be inaccurate if it has a zero offset. Conversely, scattered readings may average close to the reference but still show poor precision.
Error is the difference between a measured value and a suitable reference value. It is not automatically a mistake by the person taking the measurement.
🔢 Calculating Absolute Error
Absolute error is the magnitude of the difference:
absolute error = |measured value − reference value|If a thermometer reads 82.6°C while a trusted reference is 80.0°C, the absolute error is |82.6 − 80.0| = 2.6°C. The vertical bars mean “take the positive magnitude.”
Absolute error retains the unit, which makes it useful when a tolerance is expressed in millimetres, volts, or degrees.
📊 Calculating Percentage Error
Percentage error scales the absolute error by the reference value:
percentage error = (|measured value − reference value| / |reference value|) × 100%For the thermometer example, the percentage error is (2.6 / 80.0) × 100% = 3.25%. This expresses the discrepancy relative to the size of the quantity being measured.
Use absolute values in the usual percentage-error formula. If direction matters, report the signed error separately: the reading is +2.6°C high.
🧭 Choosing the Correct Reference Value
The formula is only meaningful when its denominator is meaningful. A reference may be a certified calibration standard, a theoretical prediction, a design nominal, or a more accurate instrument.
Do not quietly treat a nominal drawing dimension as the true manufactured dimension. A nominal is often a target, while the actual accepted range is controlled by tolerance.
In experiments, an accepted value may itself have uncertainty. In that case, percentage error describes agreement with the accepted estimate, not proof of an exact truth.
⚖️ Percentage Error Versus Percentage Difference
Percentage error compares a result with an identified reference. Percentage difference compares two values when neither is clearly the true or accepted one.
percentage difference = |A − B| / ((|A| + |B|) / 2) × 100%Two technicians measuring the same plate might obtain 101.2 mm and 100.6 mm. Percentage difference is appropriate for comparing their readings; calling one result an error assumes one is the reference.
🧩 Relative Error Before Converting to Percent
Relative error is simply absolute error divided by the reference value. It is usually written as a decimal, such as 0.0325, rather than 3.25%.
This distinction matters in spreadsheet formulas and programming. Multiplying by 100 twice turns 3.25% into an incorrect 325%.
🛠️ A Manufacturing Inspection Example
Suppose a pin is measured at 9.94 mm against a nominal diameter of 10.00 mm. The absolute deviation from nominal is 0.06 mm, and the percentage deviation is 0.6%.
That percentage does not decide acceptance. If the specification is 10.00 ± 0.10 mm, the pin is within tolerance. If it is 10.00 ± 0.03 mm, it is not. Fitness for purpose comes from tolerance, not percentage error alone.
🔬 What Measurement Uncertainty Means
Uncertainty states a range within which the value is reasonably expected to lie under stated conditions. It describes the quality of the measurement result, not merely its difference from a target.
A result written as 9.94 ± 0.02 mm says that the method supports a stated interval around 9.94 mm. The meaning of ± must be defined: it might represent instrument resolution, an estimated standard uncertainty, or an expanded uncertainty.
📝 Reporting a Result Clearly
A useful engineering result includes the value, unit, uncertainty, and enough context to interpret it. For example: pressure = 245.3 ± 1.2 kPa, measured at 22°C.
Report the uncertainty to one significant figure in many routine cases, or two when the leading digit is 1 or 2. Round the measured value to the same decimal place as its uncertainty.
Thus, 245.347 ± 1.18 kPa is usually better reported as 245.3 ± 1.2 kPa.
📐 Resolution Is Not the Whole Uncertainty
Resolution is the smallest display increment an instrument can show. A calliper displaying 0.01 mm has 0.01 mm resolution, but its total uncertainty can be larger because of jaw wear, zero error, alignment, force, and calibration.
Resolution supplies one contribution to uncertainty. It should not be presented as the entire uncertainty unless the measurement conditions justify that simplification.
🌡️ Random Effects and Systematic Effects
Random effects cause readings to vary unpredictably, such as electronic noise or small changes in reading position. Repeating measurements can reveal and reduce the influence of random variation on an average.
Systematic effects consistently shift readings, such as a scale with a zero offset or a temperature sensor with calibration drift. Repetition alone does not remove systematic bias.
Good measurement work looks for both: repeated readings for scatter, and calibration or method checks for bias.
🔁 Using Repeated Measurements
When random variation is relevant, take repeated independent readings under controlled conditions. Calculate the mean as the best central estimate, then examine the spread rather than reporting only the average.
If five voltage readings cluster tightly, the process may be repeatable. If they drift steadily, the readings may not be independent; investigate temperature rise, battery discharge, or another changing condition before applying routine statistics.
📉 Standard Deviation and Standard Uncertainty
For repeated data, the sample standard deviation describes the spread of individual readings. The standard uncertainty of the mean is commonly estimated by dividing that standard deviation by the square root of the number of independent readings.
standard uncertainty of mean = sample standard deviation / √nThis reduction applies to random variation, not uncorrected bias. Ten readings from a miscalibrated instrument can produce a very precise but inaccurate average.
🧪 Type A and Type B Evaluations
A common classification separates uncertainty estimates by how they are evaluated.
| Evaluation | Typical basis | Example |
|---|---|---|
| Type A | Statistical analysis of repeated observations | Scatter in repeated voltage readings |
| Type B | Other technical information and judgement | Calibration certificate, specification, resolution, prior data |
Type B does not mean inferior. A traceable calibration certificate may provide stronger information than a short, noisy set of repeated measurements.
🧱 Building an Uncertainty Budget
An uncertainty budget lists significant inputs that can affect a result and shows how each is estimated. It turns a vague “approximately” into an auditable engineering statement.
- Instrument calibration and zero offset
- Display resolution or reading interpolation
- Repeatability of the method
- Environmental effects, including temperature
- Fixture alignment, contact force, or operator technique
- Uncertainty in reference standards and input data
Include effects that are plausible and material to the decision. Listing every imaginable influence without estimating its scale can obscure the important contributors.
➕ Combining Independent Uncertainties
When uncertainty contributions are independent and expressed as standard uncertainties, a widely used approach is the root-sum-square method:
uc = √(u1² + u2² + ... + un²)For example, contributions of 0.10 mm and 0.20 mm combine to about 0.22 mm, not 0.30 mm. Simply adding them is more conservative, but may overstate uncertainty when the effects are independent and random-like.
Independence is an assumption. Shared temperature conditions or a common reference can create correlation, requiring a more careful model.
📈 Expanded Uncertainty and Coverage
Engineers sometimes report expanded uncertainty, written as U = k × uc, where k is a coverage factor. The chosen factor and intended coverage should be stated because “±” alone can be ambiguous.
A value such as 50.0 ± 0.4 N, with k = 2, communicates more than 50.0 ± 0.4 N without context. The exact interpretation depends on the uncertainty model and distribution assumptions.
🧮 Propagating Uncertainty Through Calculations
Many engineering quantities are calculated rather than directly measured. If density is mass divided by volume, uncertainty in both inputs affects the density.
For multiplication and division, relative uncertainties are often convenient. For independent inputs, combine the relative standard uncertainties by root-sum-square:
ur(Q) = √(ur(A)² + ur(B)²)This is an approximation suited to many small-uncertainty cases. Nonlinear models, large uncertainties, and correlated inputs may need sensitivity coefficients, numerical simulation, or specialist review.
➗ Addition and Subtraction Need Absolute Terms
For addition and subtraction, work with absolute uncertainty rather than relative uncertainty. If a length is calculated as 120.0 mm − 35.0 mm, uncertainty in each length contributes to uncertainty in the difference.
This distinction prevents a common error: applying a percentage uncertainty rule to every formula regardless of its mathematical form.
🧷 Sensitivity: Which Input Matters Most?
An input can have a modest uncertainty yet strongly affect the result if the calculation is highly sensitive to it. In a formula such as flow rate proportional to diameter squared, diameter uncertainty deserves close attention.
An uncertainty budget should therefore rank contributions after they have been translated into their effect on the final output. That ranking guides worthwhile improvements.
🧯 Near-Zero Reference Values
Percentage error becomes unstable when the reference value is zero or very close to zero. Dividing by zero is impossible, and dividing by a tiny number can make an insignificant absolute discrepancy look enormous.
For a sensor expected to read 0.00 V, report absolute offset in volts or millivolts. Choose a meaningful full-scale value or engineering limit only if it is explicitly relevant to the decision.
🏗️ Tolerance, Uncertainty, and Conformance
Tolerance defines the permitted range for a product or process. Measurement uncertainty describes doubt about the reported measurement. They answer different questions.
A measured dimension close to a tolerance boundary requires a decision rule. Depending on the application, an organisation may use guard bands: acceptance limits set inside the specification limits to reduce the risk of accepting a nonconforming item.
That approach can increase rejection of acceptable parts, so the rule should reflect the consequences of false acceptance and false rejection.
🚫 Common Percentage Error Mistakes
- Using the measured value rather than the reference value in the denominator when calculating percentage error.
- Forgetting the absolute value when only the magnitude of error is requested.
- Calling disagreement between two ordinary readings “error” when neither is a valid reference.
- Reporting excessive decimal places unsupported by the instrument or method.
- Comparing percentage errors across quantities without considering whether the same reference basis was used.
Most mistakes are not difficult mathematics. They come from failing to define what is being compared and why.
🧰 Common Uncertainty Mistakes
- Treating display resolution as the complete uncertainty.
- Reducing a suspected calibration bias by taking more readings.
- Adding all contributions linearly without explaining the chosen method.
- Using a coverage factor without saying what it represents.
- Ignoring temperature, alignment, or setup effects in high-accuracy work.
A short uncertainty statement with clear assumptions is usually more useful than a long calculation with unexplained inputs.
💻 Spreadsheets and Software Checks
Spreadsheets are effective for repeated calculations, but formula errors can propagate silently. Keep raw readings separate from calculated cells, label units in headings, and protect or review formula ranges.
Use a simple hand calculation to check at least one row. Also test obvious cases: if measured and reference values are equal, percentage error must be zero; if an input uncertainty increases, the combined uncertainty should not decrease.
🧑🔧 Improving a Measurement System
Improvement starts by identifying the dominant contributor, not by buying a more finely displayed instrument. A better fixture may reduce alignment error more than an extra decimal place on a calliper.
Possible actions include calibrating the instrument, controlling temperature, standardising contact force, improving the datum surface, automating data capture, or increasing repeat readings where random noise dominates.
Every improvement has a cost. Match measurement effort to the tolerance, safety consequence, and value of the decision.
📋 A Practical Calculation Workflow
- Define the measurand: exactly what quantity is being measured.
- Select the reference value or comparison basis.
- Record units, conditions, instrument identity, and raw readings.
- Calculate absolute and percentage error when a valid reference exists.
- Identify uncertainty sources and estimate significant contributions.
- Combine contributions using a method consistent with their behaviour and assumptions.
- Round and report the final result clearly, including coverage information where used.
- Compare the result with tolerance using an agreed decision rule.
This sequence keeps the engineering purpose visible: the goal is a defensible decision, not merely a polished number.
🧠 The Core Principle to Remember
Percentage error answers, “How far is this result from a reference, relative to that reference?” Uncertainty answers, “How much doubt surrounds this measurement result?”
Neither replaces the other. A small percentage error does not prove a measurement system is reliable, and a tight uncertainty interval does not prove agreement with a target if systematic bias remains.
Sound engineering measurement combines a suitable reference, a transparent uncertainty estimate, and a decision rule connected to the real requirement.
Calculate carefully, state assumptions openly, and let the required decision determine the level of measurement rigour. 📐🔍⚙️