
A microphone can respond to the faint rustle of a page and, moments later, to a nearby shout. A structural sensor may measure vibrations smaller than a millimetre while also recording movement large enough to indicate a developing fault. Engineers routinely work with quantities that refuse to stay within a comfortable numerical range.
Writing every value on an ordinary linear scale quickly becomes awkward. If one measurement is a million times larger than another, the smaller value may collapse into an invisible dot, even though it is the signal that matters most.
Logarithmic scales solve this communication and analysis problem by changing what equal spacing means. Instead of representing equal differences, they represent equal ratios.
That simple shift makes sound levels, electrical gain, chemical concentration, earthquake measurements, optical brightness, and frequency response far easier to compare. The scale does not make the underlying system less complex; it gives the system a form that engineers can inspect, calculate, and communicate clearly.
🧭 The Range Problem in Engineering
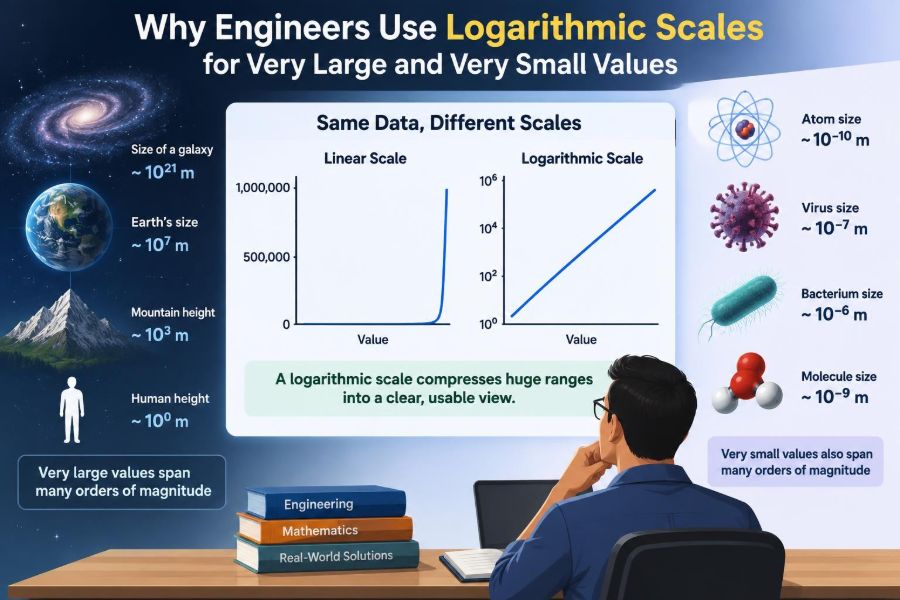
Many physical quantities span several orders of magnitude. An order of magnitude is a factor of ten: moving from 1 to 10 is one order, from 1 to 100 is two orders.
A linear axis gives the same physical length to 1–2 as it gives to 1,000,001–1,000,002. That is appropriate when absolute change is the question, but it hides small values whenever the full range is huge.
📏 What a Linear Scale Actually Shows
On a linear scale, equal distances mean equal additions. The points 2, 3, and 4 are evenly spaced because each step adds one unit.
This is ideal for a ruler, a tank level, or a temperature difference where adding 5 units has the same practical meaning across the range. But linear displays are not automatically neutral or superior; they encode a particular definition of “equal.”
🔢 What a Logarithmic Scale Changes
On a base-10 logarithmic scale, a value is positioned by its logarithm: y = log10(x). Values 1, 10, 100, and 1,000 appear equally spaced because each is ten times the previous one.
The key idea is that equal distances represent equal multiplication. A move of one decade can mean 0.1 to 1, 1 to 10, or 1,000 to 10,000.
✖️ Why Ratios Often Matter More Than Differences
Suppose an amplifier output rises from 1 V to 2 V. It has doubled. A rise from 100 V to 101 V is a larger absolute increase, but only a 1% relative change.
For gain, attenuation, error, growth, and signal strength, the ratio commonly carries the engineering meaning. Logarithms make equal percentage-like changes visually comparable across wide ranges.
🔟 Decades Provide a Useful Mental Model
A decade is the interval between a number and ten times that number. It is the basic visual unit of many engineering graphs.
Within a decade, the spacing is not uniform in the original values. On a base-10 axis, 2 lies noticeably after 1, 5 lies further along, and 9 sits near 10. This reflects logarithms, not a distorted drawing.
- 1 to 10: one decade
- 10 to 100: one decade
- 100 to 1,000: one decade
🧮 The Rule That Makes Logs So Powerful
Logarithms turn multiplication into addition: log(ab) = log(a) + log(b). They turn division into subtraction: log(a/b) = log(a) - log(b).
This matters because many engineering systems multiply effects. Cascaded amplifier gains multiply, transmission losses multiply, and repeated reduction factors multiply. In logarithmic form, those operations become easier sums and differences.
📈 Straight Lines Can Reveal Power Laws
A power law has the form y = Cx^n, where C and n are constants. Taking logarithms gives log(y) = log(C) + n log(x).
So a power law becomes a straight line on a log-log plot. The slope is n, which lets an engineer recognize a relationship and estimate its exponent from data.
🪜 Semi-Log and Log-Log Plots Are Different Tools
A semi-log graph uses one logarithmic axis and one linear axis. It is useful when one variable changes exponentially, such as idealized exponential decay or growth.
A log-log graph uses logarithmic axes for both variables. It is particularly useful for power-law behavior, scale-dependent measurements, and relationships that span broad input and output ranges.
| Graph type | Often makes this relationship straight | Typical use |
|---|---|---|
| Linear-linear | y = mx + b |
Constant-rate change |
| Semi-log | y = Ae^(kx) |
Exponential processes |
| Log-log | y = Cx^n |
Power laws and scaling |
🔊 Decibels Compress Enormous Sound Ranges
The decibel, or dB, expresses a ratio logarithmically. For power quantities, the ratio is written as 10 log10(P2/P1). For voltage or pressure ratios under the appropriate matching conditions, it is commonly written as 20 log10(A2/A1).
Decibels are not inherently a unit of sound. They are used throughout acoustics, electronics, radio systems, and control engineering because gain and loss occur naturally as ratios.
🎚️ Why Decibel Values Need a Reference
A value such as “20 dB” is incomplete unless context shows whether it is a gain relative to an input or a level relative to a defined reference. The reference determines the meaning.
For example, dB SPL refers to a sound-pressure reference, while dBm refers to power relative to 1 milliwatt. Treating all dB labels as interchangeable creates avoidable design and communication errors.
⚡ Electronics Adds Gain by Adding Decibels
If two amplifier stages have gains of 10 and 100, their total voltage gain is 1,000. In decibels, approximately 20 dB plus 40 dB gives 60 dB.
Similarly, cable loss, filter attenuation, antenna gain, and amplifier gain can be assembled in a link budget by adding signed dB values. Engineers must still track impedance, noise, saturation, and frequency dependence; dB arithmetic simplifies ratios, not every physical constraint.
📻 Frequency Response Needs a Logarithmic Horizontal Axis
Audio and radio frequency ranges often cover factors of hundreds or thousands. A logarithmic frequency axis gives each octave or decade comparable visual space.
This makes filter behavior easier to see. A first-order response is often summarized by a slope near 20 dB per decade in the relevant asymptotic region. On a linear frequency axis, the same trend can be compressed into an unhelpful corner.
🎵 Octaves Are Ratio-Based Too
An octave means a doubling of frequency, regardless of starting point. Going from 100 Hz to 200 Hz is one octave; so is 2 kHz to 4 kHz.
That makes logarithmic frequency displays especially natural in audio engineering. They preserve repeated proportional intervals rather than giving excessive width to the highest numerical frequencies.
🌊 Vibration Analysis Benefits From Wide-Range Views
Machine vibration may contain a strong rotating-frequency component, weaker harmonics, broadband noise, and occasional transient events. A log amplitude scale can reveal weaker features without making dominant peaks unreadable.
The display choice should match the task. A linear scale can be better when absolute displacement limits are critical, while a logarithmic view is often better for diagnostic comparison across many signal levels.
🌍 Earthquake Magnitude Illustrates Nonlinear Reporting
Earthquake magnitude scales are commonly discussed as logarithmic measures, which helps communicate a very broad range of recorded motion and energy-related quantities. A one-unit change is not a small additive step in the underlying physical measures.
The lesson for engineers is not to use magnitude labels casually. A logarithmic rating is a compact index with a defined method and interpretation, not a direct ruler of damage at every location.
✨ Optical Brightness Spans Extreme Ratios
Optical instruments may need to describe dim signals and intense sources in the same system. Exposure, detector dynamic range, attenuation, and optical density all involve situations where ratios are more manageable than raw values.
Logarithmic presentation can reveal detail in darker regions and prevent bright regions from dominating a plot. However, no plotted scale can recover information lost when a sensor has saturated.
🧪 Concentration and Acidity Show the Same Principle
The pH scale is based on the negative base-10 logarithm of hydrogen ion activity under its defined chemical framework. A change of one pH unit corresponds to a factor-of-ten change in that activity.
Engineers working with water treatment, corrosion, process systems, or laboratory measurements must remember that pH is not simply “linear acidity.” Temperature, calibration, and the solution’s chemistry affect practical interpretation.
📡 Signal-to-Noise Ratio Is Easier to Compare in dB
Signal-to-noise ratio compares desired signal power with unwanted noise power. Expressing it in dB makes ratios across receivers, sensors, and communication links easier to compare.
A higher ratio is generally desirable, but it does not alone guarantee useful performance. Modulation method, bandwidth, interference type, measurement bandwidth, and receiver design all influence the result.
🔬 Dynamic Range Is the Real Design Challenge
Dynamic range describes the span between the smallest and largest useful values a system can handle. In sensors and instruments, the lower limit may be set by noise, while the upper limit may be set by saturation or damage risk.
Logarithmic scales are valuable because they display this span compactly. They do not increase a device’s physical dynamic range; better hardware, signal conditioning, and measurement practice are still required.
🖥️ Data Visualization Can Expose Hidden Structure
A dataset may appear to contain only noise on a linear chart because its smaller values are visually flattened. A log axis can expose repeated patterns, low-level trends, or regimes with different behavior.
That visibility is useful for exploration, but it can also mislead if the reader forgets the axis transformation. Always label logarithmic axes clearly and identify the base when it is relevant.
🚫 Zero Has No Logarithm
The logarithm of zero is undefined, and logarithms of negative real values are not defined within ordinary real-number plotting. This is a practical limitation, not a software inconvenience.
Measurements containing zeros need careful treatment. Possible approaches include marking them separately, using a detection-limit symbol, choosing a different display, or documenting a justified threshold. Quietly replacing zero with an arbitrary small number can create a false visual story.
➖ Negative Values Need a Different Strategy
Some engineering signals, such as alternating voltage, signed error, and force direction, legitimately cross zero. A conventional log axis cannot show them directly.
A symmetrical logarithmic scale, a separate magnitude-and-sign display, or linear axes around zero may be appropriate. The right choice depends on whether magnitude, direction, or small deviations near zero are the central question.
🧩 Log Scales Can Hide Absolute Consequences
Equal vertical spacing on a log graph means equal ratios, not equal physical increments. A tenfold change from 1 to 10 is an increase of 9; a tenfold change from 1,000 to 10,000 is an increase of 9,000.
This is not deceptive when stated clearly, but readers can misread it. When safety limits, budget totals, or material quantities depend on absolute values, pair the log view with specific values or a linear companion plot.
🧠 A Straight Line Is Not Automatic Proof
Seeing an approximately straight line on a log plot can suggest an exponential or power-law model, but it does not prove one. Limited ranges, noisy measurements, detection limits, or transformed errors can produce convincing-looking patterns.
Engineers should check residuals, units, physical mechanisms, and uncertainty before adopting a model. A useful graph is the beginning of analysis, not the end of it.
📐 Choose the Axis From the Engineering Question
Ask what the viewer must compare. Use a linear axis when absolute differences, tolerances, or totals are central. Use a log axis when multiplicative change, wide dynamic range, or relative behavior is central.
- Use log amplitude to inspect weak and strong spectral components together.
- Use log frequency for responses covering many octaves or decades.
- Use linear plots near a zero crossing or where signed deviation matters.
- Use both views when one chart cannot answer both questions honestly.
🧾 Labeling Prevents Most Interpretation Errors
A well-designed logarithmic chart states the quantity, unit, reference, and scale type. For dB quantities, the reference is especially essential.
Tick labels should make decades or meaningful subdivisions visible without clutter. Avoid axes that merely say “log” when readers need to know whether the transformation is base 10, natural logarithm, or a specialized reported scale.
🛠️ Practical Workflow for Engineers
Start with the raw measurements and their units. Inspect minimum and maximum values, identify zeros and negative readings, and ask whether values are censored by a detection threshold or clipped by an instrument.
- Plot the data linearly to retain intuition about absolute size.
- Plot it logarithmically only where the data and question permit it.
- State the transformation and any omitted or specially handled values.
- Verify that visible trends have a plausible physical explanation.
- Report critical values in original units, not only transformed coordinates.
⚠️ Common Mistakes With Logarithmic Scales
One common mistake is calling a factor-of-ten increase “ten units higher.” Another is comparing dB values without checking whether they refer to power, voltage, pressure, or different reference levels.
Other avoidable errors include starting a log plot at zero, interpreting uneven minor tick spacing as a formatting defect, and fitting a line after transformation without considering how measurement error changed.
🔍 Logarithms Are a Language for Scale
Engineering often involves systems where a tiny input can be meaningful, a large output can be routine, and the ratio between two values says more than their difference. Logarithmic scales give those systems a readable visual and mathematical language.
They compress range, convert products into sums, and turn certain nonlinear relationships into patterns that are easier to inspect. Used carefully, they clarify rather than conceal.
✅ The Core Takeaway
Logarithmic scales are not a trick for making dramatic charts. They are appropriate when values span many factors of ten and when proportional change is the quantity engineers need to understand.
The best practice is simple: match the scale to the physics, state the reference and units, preserve the meaning of zero and sign, and keep absolute consequences visible when they matter.
Engineers use logarithmic scales because real systems often change by ratios across enormous ranges, and ratios become far more understandable when equal multiplication occupies equal space. 📐📊🔧