Skip to content
  • facebook.com
  • twitter.com
  • t.me
  • instagram.com
  • youtube.com
Engineering Mathematics

Turning Numbers Into Solutions. Powering Every Engineering Discipline.

Subscribe
  • Home
  • About
  • Blog
  • Contact
  • Online Tools
  • Engineering Mathematics App
  • Home
  • data visualization
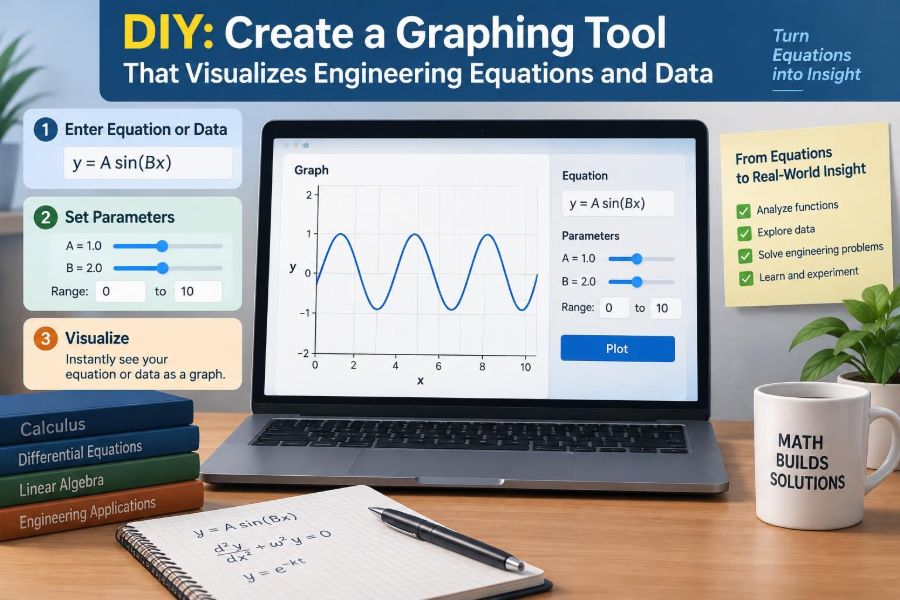
๐Ÿ“ DIY: Create a Graphing Tool That Visualizes Engineering Equations and Data
Posted inFeatured

๐Ÿ“ DIY: Create a Graphing Tool That Visualizes Engineering Equations and Data

Posted by admin October 26, 2026
Turn equations and measurement files into clear engineering plotsโ€”without hiding units, bad inputs, assumptions, or uncertainty. Build the tool step by step. ๐Ÿ› ๏ธ๐Ÿ“ˆ๐Ÿ”
Read More
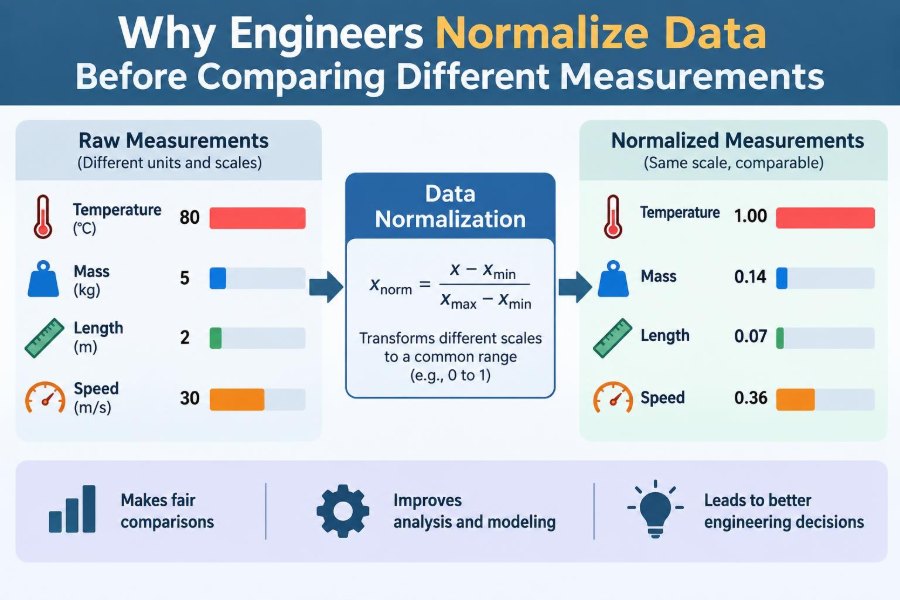
๐Ÿ“ Why Engineers Normalize Data Before Comparing Different Measurements
Posted inFeatured

๐Ÿ“ Why Engineers Normalize Data Before Comparing Different Measurements

Posted by admin October 5, 2026
Raw totals can mislead when size, time, output, and conditions differ. Learn the math behind fair engineering comparisonsโ€”and the normalization mistakes to avoid. ๐Ÿ“โš™๏ธ๐Ÿ”Ž
Read More
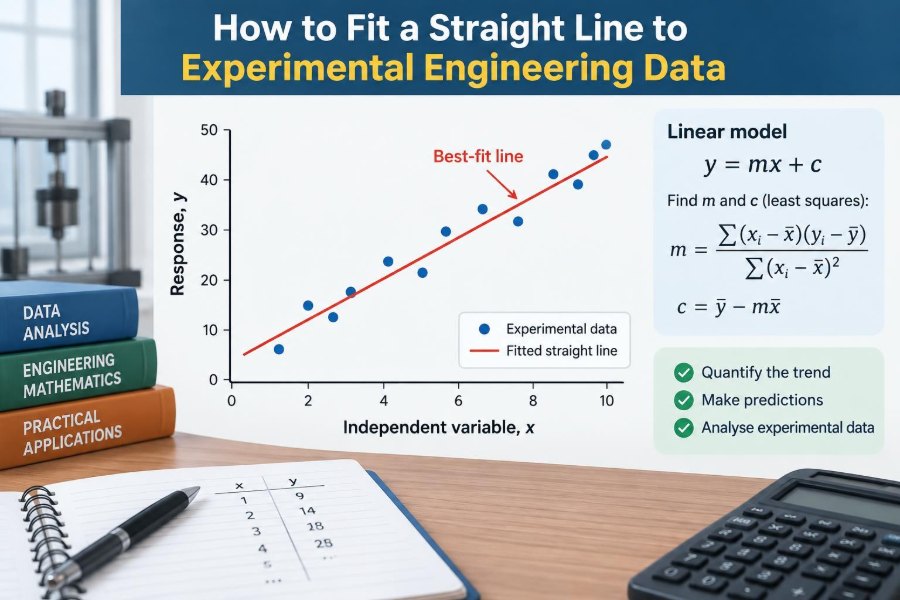
๐Ÿ“ How to Fit a Straight Line to Experimental Engineering Data
Posted inFeatured

๐Ÿ“ How to Fit a Straight Line to Experimental Engineering Data

Posted by admin October 5, 2026
Turn noisy test readings into a useful engineering model. Learn least squares, residuals, intercepts, outliers, and the traps that can distort a straight-line fit. ๐Ÿ”ง๐Ÿ“ˆ๐Ÿงช
Read More
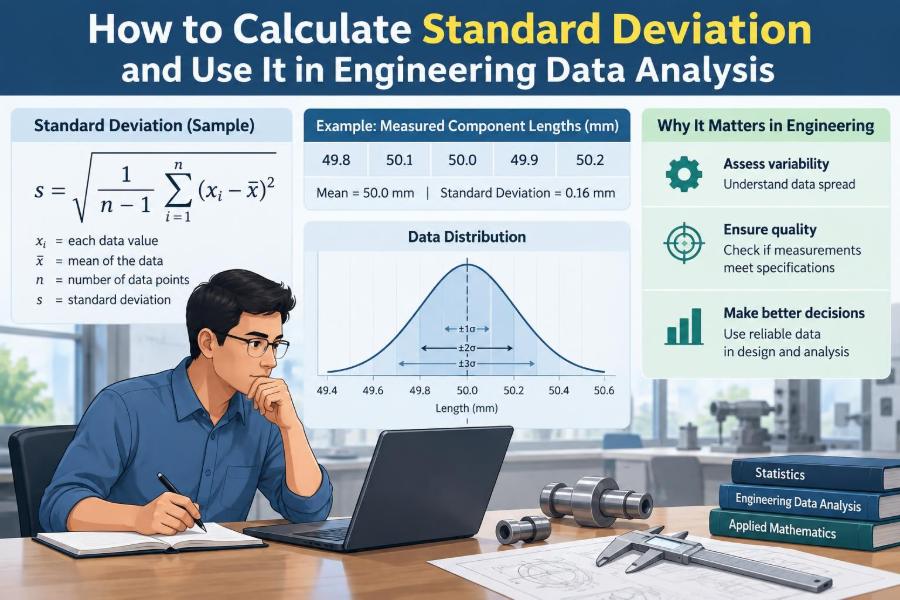
๐Ÿ“ How to Calculate Standard Deviation and Use It in Engineering Data Analysis
Posted inFeatured

๐Ÿ“ How to Calculate Standard Deviation and Use It in Engineering Data Analysis

Posted by admin September 30, 2026
Learn to calculate standard deviation, choose sample versus population formulas, and connect data spread to tolerances, process control, and real decisions. โš™๏ธ๐Ÿ“ˆ๐Ÿงฎ
Read More
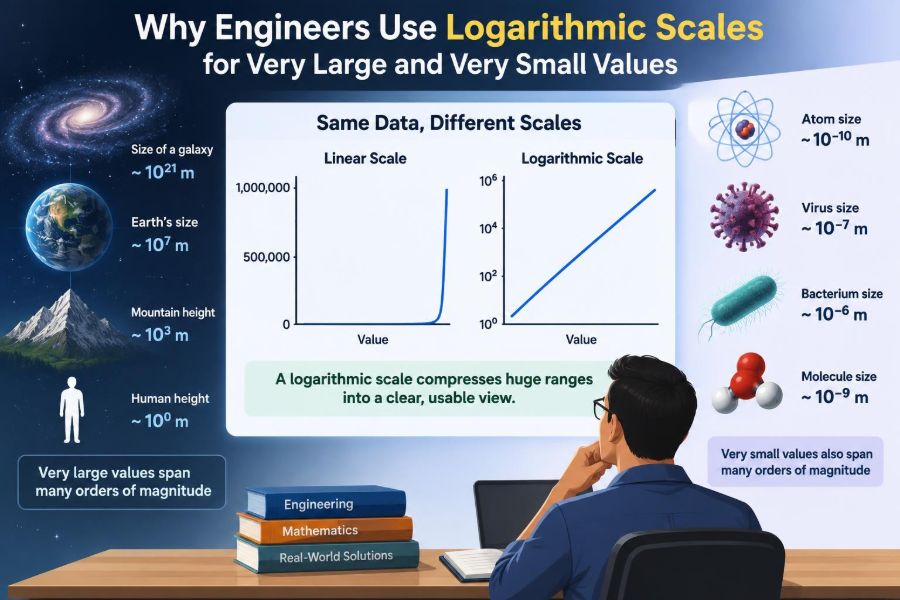
๐Ÿ“ Why Engineers Use Logarithmic Scales for Very Large and Very Small Values
Posted inFeatured

๐Ÿ“ Why Engineers Use Logarithmic Scales for Very Large and Very Small Values

Posted by admin September 23, 2026
From decibels and Bode plots to pH and sensor data, logarithmic scales make extreme ranges readable. Learn what equal spacing really meansโ€”and when it misleads. ๐Ÿ”ข๐Ÿ”ง๐Ÿ“ˆ
Read More
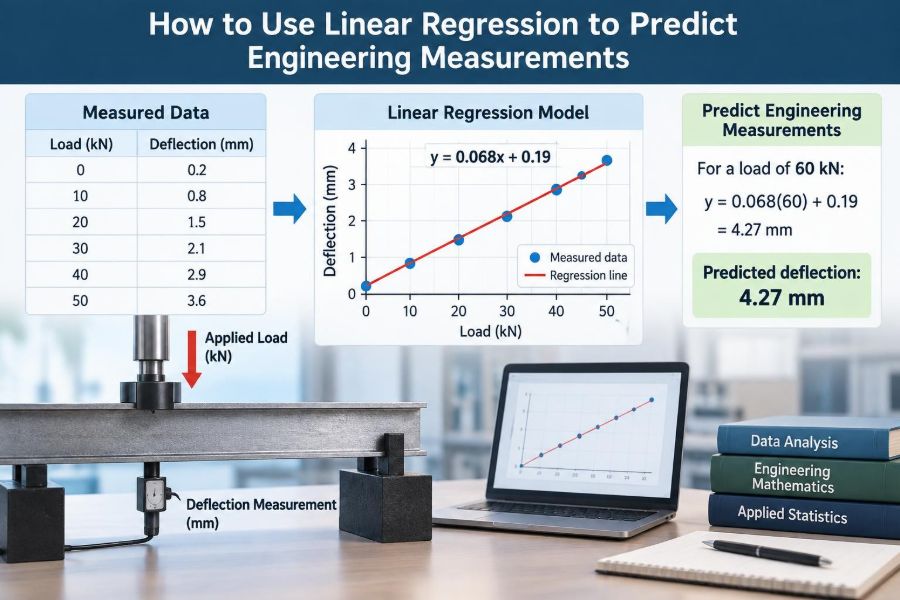
๐Ÿ“Š How to Use Linear Regression to Predict Engineering Measurements
Posted inFeatured

๐Ÿ“Š How to Use Linear Regression to Predict Engineering Measurements

Posted by admin September 22, 2026
Turn test measurements into practical estimates without trusting a trendline blindly. Learn slopes, residuals, validation, uncertainty, and safe model limits. ๐Ÿ”ง๐Ÿ“๐Ÿ“ˆ
Read More

Recent Posts

  • ๐Ÿ“ What Determines the Price of Engineering Simulation and Modeling Software?
  • ๐Ÿ“ Which Is Safer: Conservative Design Calculations or Optimized Low-Margin Designs?
  • ๐Ÿ“ How Fast Can Numerical Methods Converge to an Accurate Engineering Solution?
  • ๐Ÿ“ The Software Behind Engineering Simulations: How Numerical Solvers Turn Equations into Results
  • ๐Ÿ“ Growth of Computational Mathematics: Why Simulation Is Becoming Essential in Engineering

Recent Comments

No comments to show.

Archives

  • November 2026
  • October 2026
  • September 2026
  • August 2026
  • November 2021
  • October 2021
  • September 2021

Categories

  • basic
  • Engineering Mathematics & Applied Science
  • Featured
Copyright 2026 — Engineering Mathematics. All rights reserved. Bloghash WordPress Theme
Scroll to Top