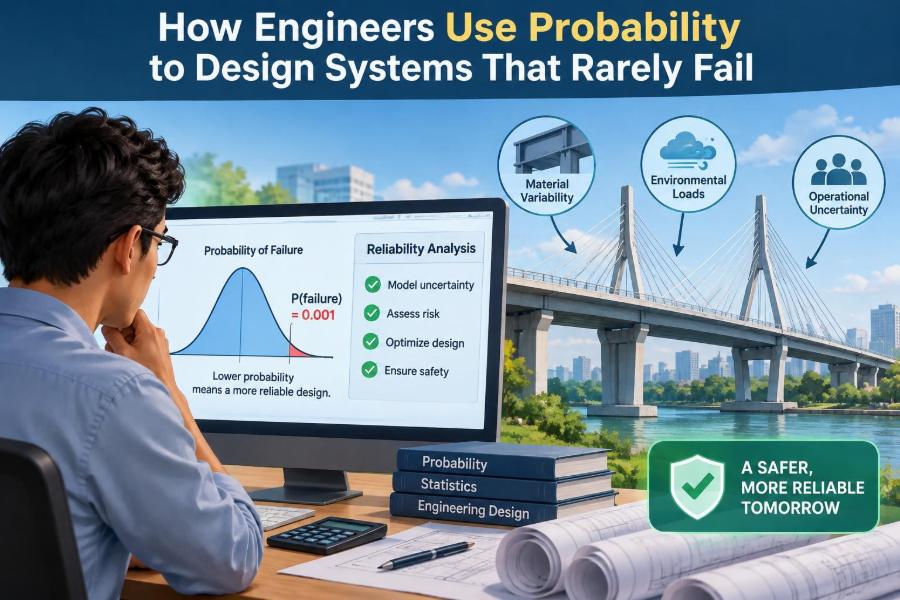

A lift arrives on the tenth floor, a traffic signal changes at the right moment, and a bridge carries thousands of vehicles through a storm. Most days, these systems feel ordinary because their failures are rare.
That reliability is not usually the result of one indestructible component. It comes from engineers asking a more realistic question: what could fail, how often might it happen, and what happens next?
Probability gives those questions a mathematical language. It helps turn uncertain loads, imperfect materials, human actions, weather, and aging equipment into design decisions that can be checked, tested, and improved.
A system cannot be made failure-proof in an absolute sense. But it can be designed so that expected failures are uncommon, detected early, contained safely, and prevented from becoming disasters.
🎯 Reliability Starts with a Precise Definition
In engineering, reliability is commonly defined as the probability that a component or system performs its required function for a specified time under specified conditions. Every part of that definition matters.
A pump that runs for one hour in a clean laboratory is not being asked to do the same job as a pump that runs for five years with abrasive water. Before calculating anything, engineers define the function, environment, operating period, and acceptable performance limits.
This avoids vague targets such as “make it dependable.” A useful requirement might instead state that a backup generator must start and supply a required load after a power loss, within defined environmental conditions.
🎲 Probability Is About Uncertainty, Not Guesswork
Probability does not mean engineers are guessing blindly. It is a disciplined way to represent uncertainty when individual future events cannot be predicted exactly.
For a single bearing, the exact day of failure may be unknown. Across many similar bearings, however, engineers can observe patterns in lifetimes, loads, defects, and maintenance records. Those patterns support estimates of failure likelihood.
Good probability models always include judgment. Data may be limited, operating conditions may change, and rare events can be difficult to observe. The calculations are therefore decision tools, not crystal balls.
🧩 Failure Means More Than a Broken Part
A component has failed when it can no longer meet its intended requirement. That can mean a cracked beam, but it can also mean a sensor drifting outside accuracy limits, a battery delivering too little energy, or software producing an unsafe output.
Engineers distinguish between several outcomes:
- Functional failure: the system no longer performs its job.
- Degraded performance: it still operates, but outside a desired range.
- Latent failure: a protective feature has failed unnoticed and is only revealed when needed.
- Hazardous failure: the failure can create an unacceptable safety or environmental consequence.
That distinction shapes the design response. A failed cabin light and a failed aircraft control sensor should not be treated as equivalent risks.
⚖️ Loads and Strengths Are Both Variable
Many physical reliability problems can be reduced to a comparison between load and strength. A structure fails when the applied load exceeds its available resistance.
Neither quantity is fixed in real life. Wind speed varies, vehicle weights vary, manufacturing dimensions vary, material properties vary, and corrosion changes strength over time. Engineers model each as a distribution rather than relying on a single “typical” value.
The overlap between the load distribution and the low-strength tail indicates possible failure. Reducing that overlap can involve increasing strength, reducing loads, controlling variability, or monitoring conditions so that dangerous operation is avoided.
📊 Why Distributions Matter More Than Averages
An average is useful, but it can hide the part of the data that causes trouble. If two batches of cables have the same average breaking strength, the batch with greater spread is usually less predictable and may have more weak specimens.
Engineers use probability distributions to describe both the center and the spread of a variable. A normal distribution is often useful for measurements influenced by many small effects, while lifetime data may follow other shapes, such as exponential or Weibull distributions.
The correct distribution should be chosen from physical understanding and evidence where possible. Selecting a convenient curve without checking whether it represents the tail behavior can seriously understate risk.
📏 The Safety Factor Is a Useful but Incomplete Tool
A factor of safety compares available strength with an expected load. If a support is designed for a capacity greater than its nominal loading, the margin offers protection against uncertainty.
But a single ratio does not reveal how uncertain the two quantities are. A design with a large nominal margin may still be concerning if material quality varies widely or rare loading is poorly understood.
Probability-based design complements safety factors by asking how often the uncertain variables could combine unfavorably. It does not remove engineering judgment; it makes the assumptions behind the margin clearer.
🛡️ Reliability Targets Depend on Consequences
Not every failure deserves the same probability target. A disposable consumer device, a factory production line, and an emergency braking system have different consequences when they stop working.
Engineers weigh consequences such as injury, environmental release, service interruption, repair cost, and loss of critical function. A low-probability event may still demand attention if its consequence is severe.
This is the basic logic of risk: probability and consequence must be considered together. Designing every item to an extreme reliability level would consume money, energy, materials, and maintenance effort without always producing proportional benefit.
🧮 From Failure Probability to Risk
A simple risk expression is often written as probability multiplied by consequence. It is best viewed as a framework rather than a complete universal formula, because consequences can be difficult to reduce to one number.
For example, a valve that occasionally sticks may be tolerable in a noncritical irrigation system if an operator can intervene. The same failure mode in a process handling hazardous pressure may require independent shutdown protection.
Risk analysis forces a useful discussion: what barriers exist, who may be exposed, how quickly can the event develop, and what is the worst credible outcome? Those questions are often as valuable as the final calculation.
⏳ Failure Rate Changes Over a Product’s Life
Many systems do not fail at a constant rate. A useful conceptual model is the “bathtub curve,” which describes high early failures, a relatively stable operating period, and then increasing wear-out failures.
Early failures can result from manufacturing defects, installation errors, or hidden design problems. Wear-out failures can arise from fatigue, corrosion, insulation breakdown, erosion, and repeated thermal cycling.
Different stages need different actions. Screening and quality control address early failures; condition monitoring and replacement plans address aging. Treating all failures as random can lead to ineffective maintenance.
🔢 Understanding the Exponential Lifetime Model
The exponential distribution is often used when a component is assumed to have a constant failure rate. Under that assumption, surviving the next hour does not depend on how long the component has already operated.
This can be a reasonable approximation for some random electronic failures during a stable portion of life. It is usually a poor model for a part that clearly wears out, such as a tire or a mechanical seal under abrasive service.
Its value lies in simplicity and in supporting system calculations. Its limitation is equally important: simple mathematics is not evidence that the physical process is simple.
🌀 Weibull Analysis Reveals Different Failure Behaviors
The Weibull distribution is widely used in reliability work because its shape can represent decreasing, roughly constant, or increasing failure rates. That flexibility makes it useful for interpreting life-test data.
A shape suggesting decreasing failure rate may point to early defects. A rising failure rate can indicate wear-out or fatigue. Engineers use these clues to investigate causes, not merely to report a fitted parameter.
Life data still need careful handling. Mixed populations, small samples, changing operating conditions, and censored tests—where some items have not yet failed—can distort conclusions if ignored.
🔗 Series Systems Are Only as Strong as Their Weak Links
In a series system, every required element must work for the overall function to succeed. If power, a controller, a sensor, and an actuator are all necessary, failure of any one can stop the process.
For independent components, system reliability is found by multiplying the individual reliabilities. The result becomes lower as more required elements are added, even when each part is highly reliable.
This does not mean engineers should eliminate components indiscriminately. It means complexity has a reliability cost. Good architecture avoids unnecessary dependencies and identifies elements that deserve stronger design or backup.
🔁 Parallel Redundancy Creates Another Path
Parallel redundancy provides more than one path for a required function. Two independently supplied pumps, for example, may allow service to continue when one pump fails.
Redundancy is powerful only when the backup can actually take over. It needs sufficient capacity, a reliable switch or control logic, testing, access to power or fuel, and maintenance that keeps it ready.
There is also a cost: extra components can add complexity and introduce new failure modes. Redundancy should be designed around a specific loss scenario, rather than added as a vague symbol of safety.
🌩️ Common-Cause Failures Can Defeat Backups
Two backups are not truly independent if the same event can disable both. Flooding may reach two pumps in the same room; a software defect may affect two identical controllers; one contaminated fuel supply may stop multiple generators.
These are common-cause failures, and they are a central reason that naive redundancy can disappoint. Probability calculations that assume independence will look overly optimistic if shared vulnerabilities are ignored.
Effective separation may involve physical distance, diverse equipment, independent supplies, different routes for cables, or distinct software implementations. The appropriate method depends on the hazard being controlled.
🌳 Fault Trees Map How Bad Outcomes Occur
A fault tree starts with an unwanted top event, such as “emergency cooling unavailable,” and works backward through combinations of failures that could cause it. Logical gates show whether one event is enough or whether several must occur together.
This method is useful because it exposes assumptions visually. A team can see whether a supposedly independent backup shares a breaker, room, operator action, or maintenance procedure with the primary system.
Fault trees are not limited to hardware. They can include human actions, software conditions, utilities, and environmental events, provided the events are defined clearly enough to analyze.
🧭 Event Trees Follow What Happens After an Initiating Event
An event tree works in the forward direction. It begins with an initiating event, such as a pipe rupture, then considers whether detection works, isolation succeeds, backup protection operates, and consequences are contained.
It is especially helpful when several protective layers exist. Rather than asking only “can the pipe rupture?”, engineers ask what sequence follows and which barriers most strongly influence the final outcome.
Together, fault trees and event trees support clearer system reasoning. One explores causes of a failure; the other explores the paths from an event to different consequences.
🔍 FMEA Helps Teams Find Failure Modes Early
Failure Modes and Effects Analysis, or FMEA, examines a design part by part or function by function. For each item, the team asks how it might fail, what effect would follow, how it could be detected, and what controls are needed.
For a temperature sensor, possible modes might include open circuit, short circuit, calibration drift, delayed response, or incorrect installation. Each creates a different system effect and may need a different control.
FMEA is strongest when it encourages concrete discussion. A worksheet score should never substitute for understanding mechanisms, interfaces, operating conditions, and the practical ability to detect problems.
🧱 Design Margins Absorb What Models Miss
Models cannot represent every variation in manufacturing, installation, use, or future environment. Design margins provide room for those unknowns and for errors in assumptions.
Margins may appear as extra structural capacity, additional battery energy, wider temperature tolerance, reserve processing capacity, or more time before a thermal limit is reached. The best margin depends on the dominant uncertainty.
Adding margin everywhere is not automatically wise. Extra mass can increase loads, oversized equipment can operate inefficiently, and excessive conservatism can create cost or usability problems. Engineers seek defensible margins, not arbitrary ones.
🧪 Testing Generates Evidence, Not Absolute Proof
Testing is how many reliability assumptions meet reality. Engineers may test materials, components, assemblies, software, or full systems under expected and challenging conditions.
A successful test shows that the tested item survived that particular test. It does not prove every future unit will survive every possible condition. Sample size, test duration, manufacturing variation, and environmental coverage all affect what can be inferred.
Well-planned tests target the most important uncertainties. A test that reproduces the relevant load cycle, temperature, vibration, or contamination is generally more informative than a convenient but unrealistic trial.
⚡ Accelerated Testing Must Preserve the Failure Mechanism
Waiting for years of ordinary use is often impractical, so engineers may increase stress through temperature, cycling, vibration, voltage, or load. This is called accelerated testing.
The danger is that excessive acceleration can create a failure mechanism that would not occur in normal service. A material may soften, crack, or chemically degrade in a way unrelated to its intended environment.
Acceleration models require physical justification. Engineers compare failure signatures, inspect failed samples, and use domain knowledge to decide whether a severe test remains relevant to field operation.
📡 Monitoring Turns Unknown Condition into Data
Some failures are best prevented not by early replacement, but by observing condition. Vibration measurements can reveal bearing damage, temperature trends can expose overheating, and pressure readings can suggest blockage or leakage.
This approach is called condition-based or predictive maintenance when data are used to plan intervention before functional failure. It can reduce unnecessary replacement while avoiding unexpected downtime.
Monitoring has limits. Sensors can drift, alarms can be poorly configured, and a measured signal may not uniquely identify the cause. Data are useful only when paired with sensible thresholds, diagnosis, and response procedures.
🛠️ Maintenance Can Improve or Reduce Reliability
Maintenance is not automatically beneficial. Replacing a worn component may prevent failure, but intrusive work can introduce wrong parts, contamination, loose connections, setup errors, or accidental damage.
Maintenance plans therefore balance age-related risk against maintenance-induced risk. They also specify inspection quality, procedures, tools, training, functional tests, and documentation.
For components with random failures and no detectable wear pattern, fixed-interval replacement may provide little benefit. For parts with clear wear-out behavior, planned replacement can be a highly effective control.
👥 Humans Are Part of the System Model
Operators, installers, maintainers, and designers interact with every technical system. Their actions should not be treated as unexplained sources of error; they are shaped by interface design, workload, training, clarity of procedures, and available time.
A confusing alarm display can increase the probability of the wrong response. A connector designed so that it only fits in the correct orientation can prevent an error before it occurs.
Human reliability improves when systems make the safe action easy, visible, and reversible where possible. Checklists, interlocks, confirmation steps, and clear feedback are practical probabilistic controls.
💻 Software Changes the Nature of Reliability
Software does not wear out like a bearing, but it can contain systematic defects. The same unhandled input or timing condition can repeatedly produce the same failure until the design is changed.
That makes diversity, testing, code review, requirements clarity, and controlled updates important. A software change can improve one function while unintentionally affecting another through shared data, timing, or interfaces.
Probability is still relevant because triggering conditions and operational exposure vary. But software assurance should not rely only on observed incident frequency, especially when rare combinations of conditions have not yet occurred.
📈 Data Quality Sets the Limit on the Model
A reliability estimate is only as credible as the evidence and assumptions behind it. Field data may contain missing operating hours, inconsistent failure definitions, unrecorded repairs, or selection bias if failed units disappear from records.
Engineers improve data quality by defining failures consistently, recording exposure time, capturing environmental conditions, and separating failure modes. A single total “failure count” can hide several unrelated mechanisms.
When data are sparse, uncertainty should be stated openly. Conservative assumptions, sensitivity studies, expert review, and additional testing may be more honest than a precise-looking number with weak foundations.
🔄 Bayesian Updating Lets Evidence Refine Expectations
Bayesian reasoning provides a formal way to combine prior knowledge with new evidence. A prior estimate might come from similar equipment, engineering analysis, or earlier tests; new field observations then update that estimate.
This is useful when evidence arrives gradually. It also prevents teams from treating either old experience or a small new sample as the entire story.
The method does not eliminate subjective judgment, because prior assumptions must be chosen. Its benefit is transparency: assumptions are explicit, and engineers can examine how strongly new evidence changes the conclusion.
🏭 Example: Designing a Reliable Pumping Station
Consider a hypothetical water pumping station that must continue supplying a critical process. Engineers begin by defining demand, operating duration, water quality, power conditions, and the consequence of interruption.
They may identify failure paths involving pump wear, blocked intake screens, motor faults, power loss, control failure, and operator error. A second pump provides capacity redundancy, but it is placed so that a single leak or fire is less likely to disable both.
Level sensors can warn of abnormal conditions, while periodic test runs reveal a standby pump that cannot start. The final reliability comes from architecture, separation, monitoring, maintenance, and realistic operating procedures—not from any one impressive component.
🚗 Example: Braking Systems Use Layers of Protection
A vehicle braking system illustrates why safety functions are analyzed as systems. Braking performance depends on mechanical components, hydraulic or electronic actuation, sensors, control logic, power supply, tire-road contact, and driver input.
Designers consider failures such as fluid loss, sensor faults, loss of electrical assistance, overheating, and degraded friction. Warning indicators, mechanical fallback behavior, diagnostic checks, and separation of critical functions can reduce the chance that one defect removes all braking capability.
The exact architecture varies by vehicle and regulation. The broader lesson is that probability guides engineers to examine combinations, degradation, and recovery paths rather than assuming a single component tells the whole safety story.
⚠️ A Small Probability Is Not Automatically Acceptable
People sometimes hear “unlikely” and stop asking questions. Engineers cannot do that, because an event may be rare but irreversible, affect many people, or occur repeatedly across a large population of similar systems.
Exposure matters. A one-in-a-million chance per operation has a different practical meaning for a device used once than for a process repeated millions of times. Time, fleet size, and number of demands all accumulate opportunity for failure.
Conversely, chasing vanishingly small improvements can divert resources from more substantial risks. Sound risk management compares alternatives and focuses on measures that meaningfully reduce credible hazards.
🚫 Common Mistakes in Reliability Reasoning
Several errors recur across industries, often because the mathematics looks more certain than the underlying situation.
- Assuming components are independent without checking shared power, location, software, suppliers, or maintenance.
- Using average loads while ignoring extreme conditions and variability.
- Counting every failure together instead of separating mechanisms.
- Extrapolating short tests to long life without a justified model.
- Ignoring degraded or latent failures because the main function still appears available.
- Treating a calculated probability as more reliable than the data and assumptions that produced it.
A useful review question is: “What would have to be true for this estimate to be wrong?”
🧠 A Practical Reliability Workflow
Probability becomes useful when it supports a repeatable engineering process rather than a report written at the end of a project.
- Define the required function, environment, duration, and unacceptable outcomes.
- Identify failure modes, causes, interfaces, and common-cause vulnerabilities.
- Estimate loads, strengths, lifetimes, and uncertainty using relevant evidence.
- Design controls: margins, redundancy, separation, detection, and safe shutdown.
- Test the assumptions, inspect failures, and revise the model.
- Monitor field performance and update maintenance or design decisions.
The loop continues through the system’s life. Reliability is maintained through feedback, not declared once at launch.
🌟 The Core Principle: Design for Managed Uncertainty
Engineers do not use probability to promise that failure will never occur. They use it to identify where uncertainty can combine with consequences, then to create layers of protection proportionate to the risk.
Reliable systems usually share a pattern: clear requirements, realistic models, appropriate margins, careful attention to dependencies, evidence from testing, and learning from operation. They are designed not only to work under normal conditions, but also to fail gracefully when conditions depart from normal.
The most valuable reliability question is rarely “What is the exact chance of failure?” It is “Which assumptions, mechanisms, and barriers most determine whether this system remains safe and useful?”
Probability helps engineers build systems that rarely fail by making uncertainty visible, measurable, and manageable—not by pretending it can be eliminated. That mindset turns mathematics into safer design choices, better maintenance, and more resilient everyday infrastructure. 📐🛡️⚙️