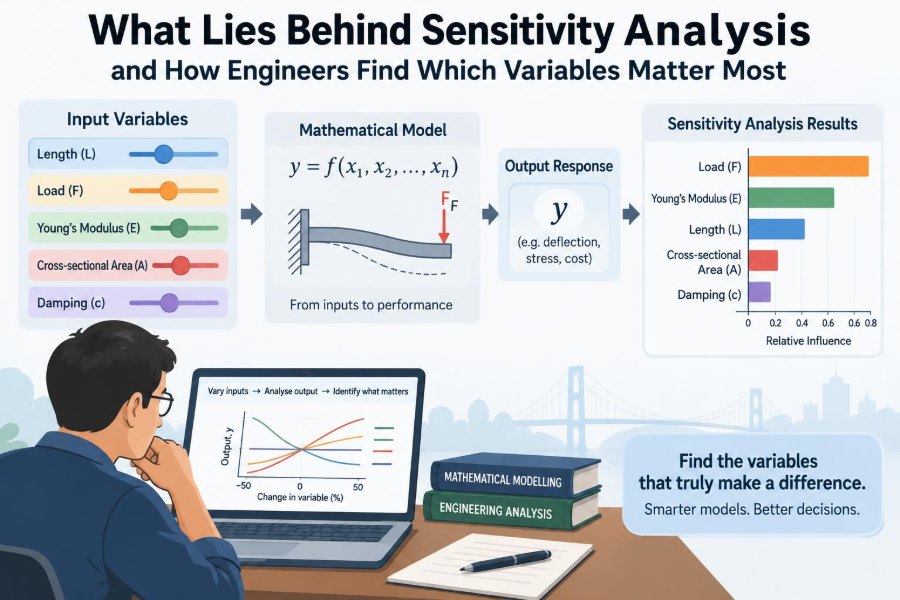

A bridge model predicts a comfortable safety margin. Then a material property shifts slightly, a load estimate changes, or a temperature assumption moves outside its usual range. Suddenly, the predicted margin is much smaller than expected.
That experience is not limited to civil engineering. A process engineer sees yield change with feed temperature. A designer watches battery life respond to ambient conditions. A project team finds that one uncertain cost input can reshape an otherwise confident estimate.
Every engineering calculation rests on inputs: dimensions, properties, loads, boundary conditions, demand forecasts, and model choices. Some barely affect the answer. Others control it.
Sensitivity analysis is the disciplined way to discover which inputs matter, how much they matter, and where better information or tighter control is worth the effort. It turns a model from a machine that produces a number into a tool for reasoning about decisions.
🔍 Sensitivity analysis in plain language
Sensitivity analysis examines how a model output changes when one or more inputs change. The output might be stress, fuel consumption, flow rate, project cost, deflection, reliability, or a pass-fail design criterion.
Its central question is simple: if this assumption is wrong or this operating condition moves, what happens to the result? The answer helps engineers separate influential variables from background detail.
🧮 Models connect inputs to decisions
An engineering model can be written compactly as y = f(x₁, x₂, ..., xₙ), where y is an output and the x values are inputs. Sensitivity analysis studies the behavior of that function, not merely one calculation at one set of values.
For a beam, inputs may include span, load, section dimensions, and elastic modulus. For a heat exchanger, they may include inlet temperatures, flow rates, heat-transfer area, and fouling resistance. The useful variables are those tied to the decision being made.
🎯 Why a single predicted value is rarely enough
A model output is often reported as one number, but that number is conditional on its assumptions. A pressure drop of a certain value only applies for the selected roughness, fluid properties, geometry, and flow condition.
Sensitivity analysis exposes that conditional nature. It shows whether a result remains stable across reasonable changes or whether a small shift could alter a component choice, operating limit, or safety conclusion.
📏 Local sensitivity and the slope of a response
For a continuous input, local sensitivity is commonly represented by a derivative: ∂y/∂x. It describes the output’s rate of change with respect to an input near a chosen operating point.
If a small increase in pipe diameter causes a large reduction in pumping power, the local sensitivity is substantial there. Derivatives are efficient and informative, but they describe nearby behavior; they may miss a curve, threshold, or regime change farther away.
⚖️ Raw changes need a common scale
Comparing raw derivatives can be misleading because inputs use different units. A derivative expressed per millimetre cannot be directly ranked against one expressed per degree Celsius.
A common alternative is normalized sensitivity, such as (x/y)(∂y/∂x). This approximates the percentage change in output caused by a one-percent change in input, making comparisons more meaningful when values are positive and the model is smooth.
📉 One-at-a-time analysis provides a first look
In a one-at-a-time study, an engineer holds all other inputs fixed and varies one input through a plausible range. The output is then plotted or tabulated against that input.
This method is easy to explain and often catches obvious drivers quickly. It is particularly useful during early design, when a model is modest in size and the goal is to understand basic behavior rather than make a full uncertainty claim.
🌀 Variables can interact with each other
One-at-a-time analysis can fail when the effect of one variable depends on another. For example, insulation thickness may have a different economic value at different energy prices, while a structural geometry may respond differently under varying load combinations.
An interaction exists when changing x₁ alters the sensitivity to x₂. In such cases, examining each variable alone can understate risk or incorrectly rank the variables.
🧭 Global sensitivity explores the whole design space
Global sensitivity analysis varies several inputs across their ranges simultaneously. Rather than asking what happens near one nominal point, it asks which inputs explain variation across the region that the system may actually occupy.
This broader view is useful for nonlinear simulations, wide operating envelopes, and early design studies with substantial uncertainty. It requires more model evaluations, but it can reveal interactions and important regions that local methods overlook.
🎲 Sampling is how complex models are explored
When formulas are too complicated for direct analysis, engineers evaluate the model at carefully chosen combinations of inputs. Random sampling is possible, but structured methods can cover a multidimensional space more evenly.
Latin hypercube sampling, for example, spreads samples through each input range instead of allowing many to cluster accidentally. The purpose is not to create randomness for its own sake; it is to obtain useful coverage with a practical number of simulations.
📊 Tornado charts make rankings visible
A tornado chart displays the change in an output caused by moving each input from a low value to a high value. The widest bars identify variables with the greatest modeled influence over the selected ranges.
It is a clear communication tool for design reviews. However, its ranking depends on the ranges chosen, the baseline assumptions, and the fact that variables are usually changed separately. A wide bar is not automatically proof of the greatest real-world uncertainty.
🗺️ Response surfaces reveal shape, not just rank
A response surface is a plot or fitted approximation showing how an output varies with two or more inputs. Contours can reveal valleys, ridges, plateaus, and regions where a constraint is violated.
For instance, a contour map of maximum temperature against coolant flow and ambient temperature can show whether additional flow is useful only on hot days. That insight is more actionable than a single ranked list.
🧱 A simple beam example
Consider a hypothetical simply supported beam carrying a central load. Its deflection depends strongly on span and section stiffness. For a familiar idealized case, deflection grows rapidly as span increases and falls as the second moment of area increases.
This does not mean material modulus is irrelevant. It means an engineer should test the actual ranges: a small uncertainty in span may be less consequential than a large uncertainty in modulus, manufacturing tolerance, or load estimate. Sensitivity combines model behavior with realistic variation.
🌡️ Nonlinearity changes the story
A linear model responds in a proportional way: doubling a small input change doubles the output change. Many engineering systems are not like this. Frictional losses, heat transfer, chemical kinetics, buckling, and saturation effects can be strongly nonlinear.
In a nonlinear model, sensitivity may be modest in one region and severe in another. Plotting the response across the full relevant range is often safer than assuming the slope at the nominal point applies everywhere.
🚧 Thresholds and discontinuities demand special care
Some outputs change abruptly when a limit is crossed: a valve opens, a contact surface engages, a control system saturates, flow changes regime, or a design constraint becomes active. Classical derivatives may be undefined or unhelpful at such points.
The practical question then becomes probability and proximity: how close is the system to the threshold, and what combinations of conditions can cross it? Scenario analysis and deliberately targeted simulations are often more useful than a single local derivative.
🎯 Sensitivity is not the same as uncertainty
A highly sensitive variable is one that can move the output substantially. An uncertain variable is one whose true value is poorly known or naturally variable. These are related but distinct ideas.
A precise dimension may have high sensitivity but little practical risk if it is tightly controlled. Conversely, a poorly known parameter may matter little if the output barely responds to it. Decision priority usually comes from considering both influence and uncertainty together.
📦 Input ranges must be physically credible
A sensitivity result is only as meaningful as the ranges supplied to the analysis. Testing a temperature, load, or material property far beyond credible operating conditions can create a dramatic but irrelevant ranking.
Ranges should come from design requirements, measurements, manufacturing tolerances, operating envelopes, justified scenarios, or engineering judgment. Documenting their origin matters because another team may reasonably choose different bounds for a different decision.
🔗 Correlated inputs should not be varied independently
Inputs are sometimes connected. Ambient temperature and cooling demand may rise together. Material density and strength may be related within a selected material family. Geometric dimensions can be linked by a manufacturing process.
Varying correlated inputs independently can generate impossible combinations and distort results. The model should preserve known relationships, either through coupled sampling, equations, common scenarios, or constraints on allowed combinations.
🎲 Monte Carlo analysis adds a distributional view
Monte Carlo simulation evaluates a model many times using sampled inputs. When input distributions and dependencies are defensible, the resulting outputs form a distribution rather than a single estimate.
This can help estimate how often a performance requirement is exceeded within the stated assumptions. It does not make uncertainty disappear: results still depend on the chosen distributions, correlations, model validity, and sampling adequacy.
🧩 Variance-based methods separate contributions
Variance-based sensitivity methods ask how much output variation is associated with each input and with interactions among inputs. They are especially valuable when the model is nonlinear and variables interact.
A first-order measure reflects an input’s individual contribution, while a total-effect measure also includes its interactions. A large gap between them is a signal that the variable matters mainly through combinations with others, not in isolation.
🧪 Screening methods save expensive simulations
High-fidelity finite-element, computational-fluid-dynamics, or multiphysics models can be expensive to run. Before applying intensive global methods, teams often use screening designs to identify inputs that appear negligible across a broad range.
The reduced set can then receive closer analysis. Screening is a resource-management step, not permission to discard variables permanently; a variable dismissed for one output or operating range may matter for another.
⚙️ Surrogate models can accelerate exploration
A surrogate, or emulator, is a faster approximation trained or fitted from a set of expensive model evaluations. It may take the form of a response surface, Gaussian-process model, polynomial approximation, or another regression approach.
Surrogates make broad sampling feasible, but they introduce their own error. Engineers should check predictions against withheld or newly evaluated simulation points, particularly near limits and regions where the response changes quickly.
🛠️ Sensitivity findings guide engineering action
The value of sensitivity analysis is not the chart; it is the decision it improves. A dominant uncertain input may justify a better measurement, tighter specification, a different sensor, or a design with more margin.
- Reduce uncertainty when an influential parameter can be measured or controlled economically.
- Redesign when performance is inherently too fragile to normal variation.
- Monitor the variable when it changes during operation and early warning is useful.
- Accept it when its influence is low relative to the decision at stake.
💰 Use sensitivity to focus budgets wisely
Not every input deserves the same testing effort. If laboratory characterization of a parameter will not alter a design decision, extra precision may have little value. If one uncertain property determines whether a costly redesign is needed, better information may be worth far more.
This is sometimes called value-of-information thinking. It connects mathematical influence to practical cost, schedule, safety margin, and consequence rather than treating accuracy as an unlimited good.
🛡️ Safety margins require more than a ranking
Sensitivity analysis supports safety reasoning, but it does not replace design codes, validation, load combinations, hazard analysis, or professional judgment. A variable can rank low in nominal output variation yet be important in a rare, high-consequence failure path.
For safety-critical work, examine relevant failure modes separately, use credible extreme scenarios, and ensure model assumptions remain appropriate near the boundary of acceptable performance. A ranking is evidence, not a safety case by itself.
🧾 Document assumptions so results can be audited
A useful sensitivity study records the model version, output metric, baseline case, input definitions, ranges or distributions, dependencies, sampling method, and treatment of failed simulations. Without this information, a colorful plot can be impossible to interpret or reproduce.
Also record what the result does not show. For example, a model may rank thermal conductivity within a chosen material range without assessing moisture effects, degradation, installation defects, or uncertainty in the governing heat-transfer correlation.
⚠️ Common mistakes that produce false confidence
Common errors include varying inputs by arbitrary equal percentages, using implausible ranges, overlooking correlations, ranking quantities with incompatible units, and reporting local derivatives as though they describe the entire operating envelope.
Another mistake is confusing a model’s sensitivity with reality’s sensitivity. A result may be highly sensitive to an assumed coefficient because the coefficient stands in for poorly modeled physics. That is a reason to examine model form, not merely refine the coefficient.
✅ A practical workflow for a first study
- Define the decision and the output that actually supports it.
- List uncertain, controllable, and scenario-dependent inputs.
- Assign credible ranges, dependencies, and units.
- Begin with plots or one-at-a-time checks to find obvious behavior.
- Use joint sampling or global methods when interactions or nonlinearity matter.
- Validate surprising patterns and translate findings into an engineering action.
Repeat the study when the design, operating envelope, data quality, or model itself changes. Sensitivity is not a one-time decoration added at the end of an analysis.
🤝 Communicating results to technical and nontechnical teams
Good communication states the decision first: for example, whether a pump selection remains adequate across expected conditions. Then show the few variables that change that decision, along with the assumptions behind their ranges.
Avoid saying an input is simply “the most important.” Say what it is most influential for, over which range, under which model, and whether it is uncertain enough to deserve action. This wording is more precise and much more useful in a review meeting.
🌟 The central principle behind variables that matter
Variables matter most when two conditions meet: the output responds strongly to them, and their values can plausibly vary enough to affect the decision. Interactions, thresholds, uncertainty, and consequences determine whether a seemingly small effect deserves attention.
Sensitivity analysis therefore asks more than which input has the steepest slope. It asks where the model is fragile, where information has value, and where design effort will produce the clearest improvement.
The purpose of sensitivity analysis is to direct attention toward the assumptions and variables that can genuinely change an engineering decision. Used with credible ranges, transparent assumptions, and sound judgment, it makes models more honest and engineering choices more resilient. 📐🔍⚙️