
A manufacturing engineer may need to choose between replacing an aging pump now or continuing repairs for five more years. A municipal team may be deciding whether a flood-control system is worth its large upfront cost. An energy developer may be comparing solar equipment, battery storage, and a conventional generator.
These choices look different on the surface, but they share a difficult feature: their costs and benefits occur at different times. Spending £1 million today is not directly comparable with saving £250,000 each year in the future.
Engineers need a method that makes those time-separated cash flows comparable without pretending that the future is certain. Net present value, usually shortened to NPV, is one of the central tools for doing that.
NPV does not decide every engineering question. Safety, service reliability, environmental obligations, and strategic needs may matter just as much. But it gives decision-makers a disciplined financial view of whether a project is expected to create value after accounting for the time value of money.
🧭 The investment decisions engineers actually face
Engineering projects commonly involve a large initial commitment followed by years of operating consequences. The project may reduce energy use, prevent failures, increase production capacity, avoid emissions charges, or generate direct revenue.
Examples include upgrading a wastewater treatment process, automating a production line, insulating an industrial building, installing a backup power system, or extending the life of a bridge. Each has a different pattern of expenditure, maintenance, savings, and risk.
NPV provides a common financial language for comparing these alternatives, even when their cash flows arrive on different schedules.
💷 What net present value means
Net present value is the value today of all expected future cash inflows and outflows, after each has been converted into present-day money. In simple terms, it asks: if future cash flows are worth less than cash available now, what is the project worth now?
A positive NPV means that, under the assumptions used, expected benefits exceed expected costs after allowing for the required return. A negative NPV means the project does not meet that financial hurdle.
For mutually exclusive projects serving the same purpose, engineers generally prefer the option with the higher NPV, provided the alternatives have been modelled consistently.
⏳ Why a pound today differs from a pound later
Money available today can be invested, used to repay borrowing, or retained as working capital. It also avoids the uncertainty of waiting for a future payment. For these reasons, a future cash receipt usually has a lower value in present terms.
This is the time value of money. It is not an argument that future outcomes do not matter; it is a method for translating them into a common date so that comparisons are meaningful.
Inflation can also affect future amounts, but it must be handled consistently with the discount rate. Mixing inflation-adjusted cash flows with a rate that already includes inflation produces a misleading result.
🧮 The core NPV equation
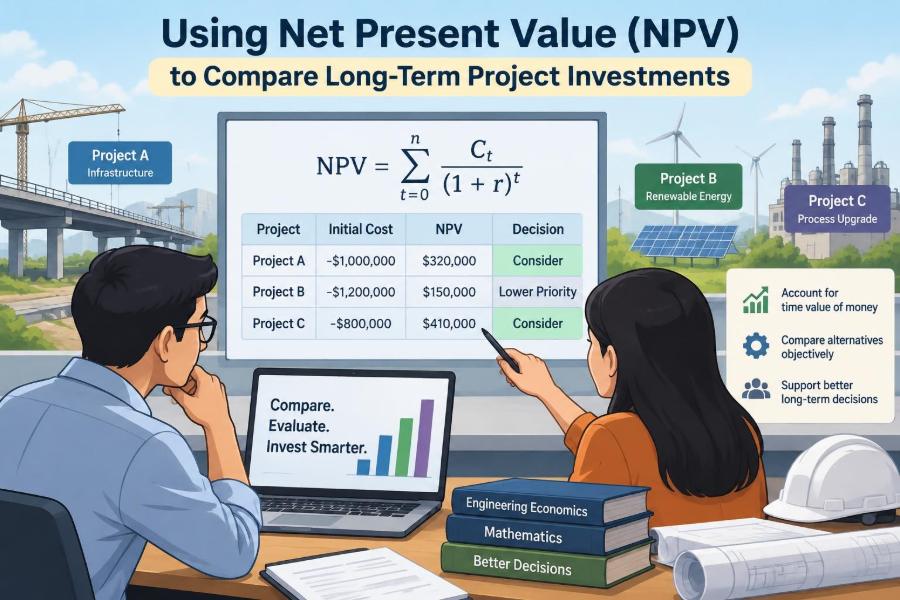
The standard expression for NPV is:
NPV = Σ [CFₜ / (1 + r)ᵗ]
Here, CFₜ is the net cash flow in period t, and r is the discount rate per period. The summation includes the initial cost, usually entered at time zero and therefore not discounted.
For an annual model with a £500,000 initial outlay and expected annual net benefits, the engineer discounts each year’s benefit separately, then adds the results to the initial negative cash flow.
🔢 Reading the variables correctly
The equation is compact, but its inputs need care. A cash inflow is positive; a payment, capital purchase, repair cost, tax payment, or decommissioning cost is negative.
- Time zero: the decision date, often when capital spending occurs.
- Cash flow: actual money paid or received, rather than accounting profit.
- Discount rate: the required return or opportunity cost appropriate to the project.
- Period: usually years, but months or quarters can be used when the rate matches the period.
Small timing errors matter. A benefit assumed to arrive at the end of year one has a different present value from the same benefit received monthly throughout that year.
🏗️ Start with a cash-flow model, not the formula
NPV is only as credible as the cash-flow forecast behind it. Before calculating anything, engineers define the project boundary: what equipment, labour, utilities, permits, supporting infrastructure, and end-of-life activities belong in the analysis?
A good model follows the incremental cash-flow principle. It includes only cash flows that change because the project is undertaken. Existing costs that continue regardless of the decision do not belong merely because they are visible in an accounting budget.
This step often requires collaboration. Engineering estimates technical performance, operations estimates staffing and downtime, maintenance estimates lifecycle work, and finance checks tax, funding, and accounting assumptions.
🏭 Capital expenditure at the beginning
Initial capital expenditure, or CAPEX, includes more than the equipment purchase price. Installation, civil works, commissioning, design, controls integration, training, spares, and temporary production disruption can be material.
Suppose a new compressor costs £300,000 but requires £80,000 of piping changes, £25,000 of installation labour, and £15,000 of commissioning tests. Treating it as a £300,000 project would overstate NPV before any operating forecast is considered.
Capital costs should be placed in the period when payment is expected. A staged construction project may require several early cash outflows rather than one time-zero number.
⚙️ Operating savings and new revenue
Benefits may arrive as reduced electricity consumption, less scrap, fewer callouts, increased throughput, lower water use, or additional sales. The relevant figure is the net change in cash generated, not simply a technical performance metric.
For example, a motor upgrade may reduce annual energy use. The value of that reduction depends on expected tariff structure, operating hours, demand charges where applicable, and whether production levels remain similar.
Revenue benefits deserve the same discipline. Extra production capacity has value only if the organisation can sell the additional output, or if the capacity prevents a real and measurable loss.
🛠️ Maintenance, replacement, and downtime
Long-lived assets rarely have smooth annual costs. Pumps may need overhauls, batteries may require replacement, and software-controlled systems may need periodic upgrades or support contracts.
Planned maintenance can improve NPV by reducing failure risk, but it is still a cash outflow that must appear in the relevant year. Likewise, avoided downtime should not be assumed automatically; it should be tied to a reasonable estimate of lost production, repair expenses, or service penalties.
Ignoring irregular lifecycle costs is a common reason why an apparently attractive project becomes disappointing after approval.
🧾 Taxes, depreciation, and accounting boundaries
Depreciation is an accounting expense rather than a direct cash payment, so it is not itself a project cash flow. However, where taxes apply, depreciation may affect taxable income and therefore create a real tax consequence.
The appropriate treatment depends on the organisation, jurisdiction, tax position, and project structure. A public-sector comparison may use a different framework from a private industrial investment.
For that reason, engineers should not copy a tax treatment from a generic spreadsheet. Finance review is especially useful when tax credits, grants, lease arrangements, or capital allowances are relevant.
🗑️ Residual value and end-of-life costs
At the end of the analysis period, an asset may have resale value, salvage value, or continuing use value. It may instead require dismantling, remediation, disposal, or site restoration.
Both possibilities belong in the final-period cash flow. A battery installation, for instance, may have a replacement or recycling obligation; a process plant may have decommissioning liabilities.
Leaving out the final cash flow makes alternatives with different end-of-life consequences look more comparable than they really are.
📉 Choosing a discount rate
The discount rate is often the most influential NPV assumption. It represents the return required for committing capital to the project, reflecting the organisation’s funding cost, alternative opportunities, and risk policy.
Companies may specify a hurdle rate or weighted average cost of capital for internal evaluation. Public and regulated projects may use prescribed appraisal rates. Engineers should use the approved basis rather than select a rate simply because it makes a preferred option look attractive.
A higher rate reduces the present value of distant benefits more strongly. Projects with large upfront costs and long-delayed savings are therefore particularly sensitive to this choice.
🌡️ Nominal and real cash flows must match
Nominal cash flows include expected inflation, while real cash flows are expressed in constant purchasing-power terms. The two approaches can both work, but each requires a matching discount rate.
| Cash-flow approach | Use this discount rate | Typical treatment |
|---|---|---|
| Nominal | Nominal rate | Forecast prices, wages, and tariffs with inflation assumptions |
| Real | Real rate | Express amounts in constant-price terms |
Using nominal electricity-price forecasts with a real rate can overvalue benefits. Using constant-price savings with a nominal rate can undervalue them. Consistency matters more than which convention is chosen.
🧪 A simple hypothetical project calculation
Consider a hypothetical heat-recovery project requiring £400,000 today. It is expected to deliver net annual energy savings of £120,000 at the end of each of the next five years, followed by a £30,000 overhaul in year three.
At an 8% annual discount rate, each annual saving is divided by (1.08)ᵗ. The year-three overhaul is also discounted, then subtracted from that year’s saving. The sum of all discounted future net benefits is compared with the £400,000 initial cost.
The resulting NPV tells the team whether the forecast benefits exceed the required 8% return. The calculation itself is straightforward; deciding whether the savings estimate, lifespan, rate, and overhaul forecast are reasonable is the harder engineering task.
📊 Interpreting positive, zero, and negative NPV
A positive NPV indicates that the project is expected to exceed the required return embedded in the discount rate. It does not mean there is no risk, nor does it prove that every forecast will occur.
An NPV close to zero means the project just meets the chosen financial threshold. This may still be appropriate if it delivers non-financial benefits such as regulatory compliance, resilience, safety improvement, or essential service continuity.
A negative NPV means the project does not meet the financial criterion under the stated assumptions. The next step is not always rejection: the team may redesign it, seek lower-cost delivery, revise an overly conservative assumption, or recognise that a non-financial requirement drives the decision.
⚖️ Comparing mutually exclusive options
Suppose a facility can choose either a lower-cost boiler with higher fuel use or a more efficient boiler with a larger initial price. If both provide the same required service over the same period, compare their NPVs directly.
The option with the higher NPV is financially preferable under the model assumptions. This comparison captures the fact that the efficient unit’s future fuel savings must be weighed against its additional upfront cost.
Do not compare an option’s NPV with a different baseline without checking that both include the same scope, operating demand, analysis period, and treatment of residual value.
📏 Different project lives require careful treatment
Alternatives often have unequal lives. One pump may last ten years, while another is expected to last fifteen. A simple NPV over one asset’s life may favour the option whose consequences are included for longer.
Engineers can address this by choosing a common planning horizon and modelling replacements, or by using an equivalent annual value approach. The right method depends on whether the service must continue indefinitely, whether replacement is realistic, and how the organisation plans capital.
The crucial point is to compare alternatives over equivalent service requirements, not merely over whichever lifespan makes one option look best.
📈 NPV versus payback period
Payback period asks how long it takes for cumulative undiscounted cash inflows to recover the initial investment. It is easy to explain and useful for liquidity concerns, but it ignores cash flows after payback and often ignores the time value of money.
A project that pays back quickly may still generate modest long-term value. Another project may pay back later yet have a much larger NPV because it produces durable benefits.
Payback can be a supplementary screening measure, especially when cash availability is tight. It should not normally replace NPV for a long-term investment decision.
🔄 NPV versus internal rate of return
The internal rate of return, or IRR, is the discount rate that makes NPV equal zero. It is often communicated as a percentage return, which can feel intuitive.
However, IRR can mislead when projects differ greatly in size, have unusual patterns of positive and negative cash flows, or are mutually exclusive. Such projects may have multiple IRRs or rankings that conflict with NPV.
NPV states expected value in money at the chosen required return. For selecting between competing investments, it is generally the more direct measure of value creation.
🧱 NPV versus lifecycle cost analysis
Lifecycle cost analysis focuses on the total cost of owning, operating, maintaining, and disposing of an asset. It is particularly useful when alternatives provide the same output and revenue is not central.
NPV can incorporate lifecycle costs, but it also includes revenues, savings, taxes, and other project benefits. In practice, a lifecycle-cost model often becomes part of an NPV appraisal once all cash consequences are included.
For public assets or internal infrastructure, teams may present both views: discounted lifecycle cost for asset stewardship and NPV for the broader investment case.
🔍 Sensitivity analysis shows what matters most
A single NPV can create false confidence when it hides uncertain inputs. Sensitivity analysis changes one assumption at a time to see how much the result moves.
For an energy project, engineers may test electricity price, annual operating hours, equipment efficiency, capital cost, and discount rate. For a production project, throughput, selling margin, and downtime may be more influential.
- Which assumptions can turn NPV negative?
- How much can installed cost rise before the project fails the hurdle?
- What minimum annual saving is needed to justify approval?
These questions focus investigation where it can improve the decision.
🌦️ Scenario analysis handles connected uncertainty
Sensitivity analysis changes one variable at a time. Scenario analysis changes several related variables together to create coherent cases, such as optimistic, central, and adverse outcomes.
An adverse case for a new production line might combine slower demand growth, lower utilisation, a delayed start date, and higher maintenance. Those events may be more realistic together than as isolated adjustments.
Scenarios do not predict the future. They show whether a proposal remains acceptable across plausible operating conditions and reveal which risks need contractual, technical, or operational controls.
🛡️ Risk is not always solved by raising the rate
It is tempting to add a large risk premium to the discount rate whenever a project feels uncertain. That can be useful in some governance frameworks, but it can also obscure the source of uncertainty and heavily penalise benefits that arrive later.
Often, better practice is to model key risks explicitly: probability of delay, performance shortfall, replacement cost, demand variation, or energy-price exposure. Then use sensitivity and scenario analysis alongside the organisation’s approved discount-rate policy.
Some risks cannot be treated as ordinary financial variations. A safety-critical failure, for example, may require design standards and risk controls regardless of the project’s NPV.
🚧 Sunk costs do not belong in the decision
A sunk cost is money already spent that cannot be recovered regardless of which option is chosen. Earlier feasibility studies, obsolete design work, or prior failed repairs may be frustrating, but they should not determine whether the next investment is worthwhile.
Only future cash flows that differ between choices are relevant. Including sunk costs can make a sound future investment appear unattractive, while excluding unavoidable future costs can create the opposite error.
This distinction is emotionally difficult because teams naturally want to justify previous spending. NPV works best when it stays focused on the decision still available.
🧩 Opportunity cost and the baseline case
Every NPV needs a baseline: what happens if the proposed project is not undertaken? The baseline may be continuing with existing equipment, performing a minimum repair, buying outsourced capacity, or accepting an identified cost.
Opportunity cost captures the value forgone by using resources in one way rather than another. If a site can use limited electrical capacity for only one of two upgrades, choosing one project may prevent a valuable alternative.
A weak baseline is a frequent source of distorted analysis. The “do nothing” case must still include realistic ongoing maintenance, failures, compliance obligations, and replacement needs.
🧰 Building a practical spreadsheet model
A transparent spreadsheet should let a reviewer trace each major number back to an assumption. Place the timeline across columns, use separate rows for major cash-flow categories, and calculate net cash flow before discounting.
Useful design choices include:
- Clearly labelled input cells for rates, asset life, inflation basis, and timing.
- Separate rows for CAPEX, operating benefits, maintenance, taxes, and terminal values.
- A visible discount-factor row rather than hidden calculations.
- Scenario switches or clearly separated cases.
- Checks that identify missing years, inconsistent signs, or double-counted items.
Spreadsheets are powerful but fragile. Formula auditing, independent review, and version control are part of sound engineering practice.
🧠 Timing conventions can change the answer
Most simplified models assume that annual cash flows occur at year end. That is reasonable for a first estimate when receipts and payments are spread relatively evenly or timing is not critical.
Projects with major seasonal revenue, staged construction payments, monthly energy bills, or early commissioning delays may need monthly or quarterly modelling. The discount rate must then be converted to the matching period.
There is no virtue in excessive precision. The model’s timing detail should be proportionate to the decision and to the quality of available data.
⚠️ Common NPV mistakes engineers should catch
The most damaging errors are usually conceptual rather than mathematical. A workbook can calculate perfectly while answering the wrong question.
- Counting accounting profit instead of incremental cash flow.
- Using an annual discount rate with monthly cash flows without conversion.
- Mixing real cash flows with a nominal discount rate, or vice versa.
- Omitting installation, outage, overhaul, or disposal costs.
- Assuming savings continue unchanged after equipment performance degrades.
- Double-counting a benefit already included in another budget line.
- Comparing options over unequal service lives without adjustment.
A short assumptions register can prevent many of these mistakes by recording source, owner, basis, and uncertainty for each important input.
👥 Communicating NPV to non-financial stakeholders
A decision meeting rarely benefits from a dense spreadsheet projected on a screen. Lead with the decision, the recommended option, its NPV, the key assumptions, and the factors that could change the conclusion.
Use plain language alongside the financial result: “This option costs more initially but is expected to save enough energy and maintenance expenditure to exceed the required return.” Show the main sensitivities rather than overwhelming the audience with every row.
Transparency builds trust. Stakeholders are more likely to support an analysis when they can see what has been assumed and where professional judgement is required.
🌱 Environmental and resilience benefits need honest treatment
Many projects reduce emissions, water consumption, waste, or vulnerability to disruption. These benefits may be financially measurable through avoided fuel use, fees, insurance costs, or expected outage losses, but not always.
Where a benefit cannot be reliably monetised, it should not be invented simply to improve NPV. Record it separately as a qualitative or multi-criteria consideration, explain why it matters, and let governance weigh it appropriately.
This is especially relevant for resilience projects. A backup system may have a modest standalone NPV yet be necessary to protect critical operations or public services during rare but severe events.
🏛️ Financial value is not the only decision criterion
Engineering decisions operate within safety duties, regulations, design standards, service commitments, environmental permissions, and organisational strategy. A project required for compliance may proceed even when its direct financial NPV is negative.
Conversely, a strongly positive NPV does not excuse unacceptable safety risks, poor constructability, or an unrealistic delivery programme. Financial analysis should inform engineering judgement, not replace it.
Many organisations therefore use NPV within a broader business case that addresses technical feasibility, risks, stakeholders, procurement, implementation, and operational readiness.
✅ A disciplined NPV workflow
A repeatable process makes results easier to review and less vulnerable to optimism or accidental omission.
- Define the decision, alternatives, baseline, and required service.
- Set a common analysis period and timing convention.
- Identify incremental cash flows across design, construction, operation, renewal, and end of life.
- Choose an approved, consistent discount-rate and inflation basis.
- Calculate NPV for each alternative.
- Test sensitive assumptions and plausible scenarios.
- Document non-financial benefits, constraints, and residual risks.
- Present a recommendation with clear conditions and uncertainties.
This workflow turns NPV from a single spreadsheet cell into a traceable engineering decision process.
🎯 The core principle engineers should remember
Net present value compares the full pattern of a project’s expected cash consequences in today’s money. It rewards neither low initial cost nor rapid payback by itself; it asks whether the discounted benefits genuinely outweigh the discounted costs.
The quality of the result depends on scope, timing, discount-rate consistency, realistic operating assumptions, and honest treatment of uncertainty. A precise-looking NPV is not automatically reliable if those foundations are weak.
Used well, NPV helps engineers explain why one long-term alternative creates more financial value than another, while leaving room for the safety, resilience, environmental, and strategic factors that money alone cannot settle.
The best NPV analysis is not the one with the most elaborate formula; it is the one that makes the project’s real trade-offs visible before capital is committed. 📐📊🔧