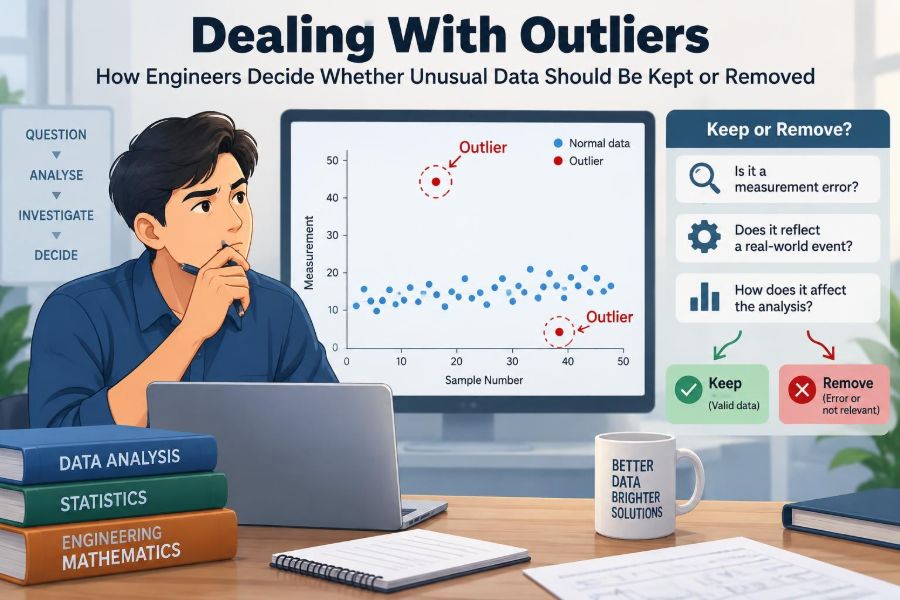

A vibration sensor on a pump reports one reading far above everything recorded that day. A junior analyst is tempted to delete it: surely the sensor slipped, the cable was loose, or the spreadsheet contains a typo.
But that single point could also be the first sign of bearing damage. Removing it without investigation may make a chart look cleaner while hiding the event that matters most.
Engineers encounter this dilemma in laboratory tests, production lines, structural monitoring, traffic models, environmental measurements, and machine-learning systems. Unusual data are not automatically errors; they are questions that require evidence.
The practical challenge is to decide whether an outlier reflects a faulty measurement, a special but real operating condition, or a meaningful change in the system itself. That decision affects designs, safety margins, maintenance plans, and confidence in every conclusion drawn from the data.
🎯 What an Outlier Actually Is
An outlier is an observation that appears unusually far from the rest of a dataset or from the pattern described by a model. “Unusual” is relative: a temperature of 80°C may be normal for an engine component and alarming for a room sensor.
Outliers may be unusually large, unusually small, or unusual because they occur at an unexpected time or combination of conditions. A point can look ordinary in one variable but become suspicious when compared with another, such as high flow with unexpectedly low pressure.
🧭 Why the Keep-or-Remove Decision Matters
A single extreme value can noticeably change an arithmetic mean, a standard deviation, and a regression line. If a load test includes one erroneous reading, an estimated material relationship may be distorted enough to affect a design calculation.
The opposite error is often more serious: deleting a valid extreme event can produce a model that works only under comfortable conditions. Engineering frequently exists to manage rare, high-consequence conditions, not merely average ones.
🔍 An Outlier Is Not Automatically Bad Data
Calling a measurement an outlier describes its position in the data; it does not identify its cause. A value may be valid, invalid, or valid but unsuitable for a particular analysis because it belongs to a different operating regime.
This distinction prevents a common shortcut: “It looks strange, so remove it.” Data cleaning should be a traceable engineering activity, not a cosmetic effort to make a plot behave.
🧪 Measurement Errors and Real Extremes
Some outliers arise from measurement problems: a miscalibrated instrument, an incorrect unit, a transcription error, a saturated sensor, or an electrical interference spike. These observations may justify correction or exclusion when the cause can be demonstrated.
Other outliers are genuine measurements of rare behavior. A wind gust, an overload event, or an abrupt pressure transient may occur infrequently while still being physically real. The data point is inconvenient precisely because the system did something unusual.
🏭 Process Changes Create Legitimate Differences
Manufacturing and field systems do not always operate in one stable state. A new raw-material batch, altered machine setting, tool replacement, shift change, or software update can shift the process.
In that case, the unusual observations may signal a process change, not random noise. Treating them as removable outliers can delay discovery of a drift that should be investigated or controlled.
📏 Start With Physics and Context
Before applying any statistical rule, ask whether the observation is physically plausible. Does it exceed a known sensor range? Does it conflict with conservation of mass or energy? Was the machine actually running at the time?
Context often resolves ambiguity more effectively than a formula. An unexpectedly high vibration reading that coincides with a recorded impact has a different interpretation from the same reading during steady operation with no related evidence.
🗂️ Check Metadata Before the Numbers
Useful data carry metadata: timestamps, instrument identifiers, calibration status, units, test specimen labels, operator notes, software versions, and sampling rates. Without this information, an analyst may only guess why a point differs.
A pressure value that seems impossible may turn out to be recorded in kilopascals while the rest are in pascals. A time-series spike may align with a sensor restart. Preserving provenance makes later review possible.
📈 Plot the Data Before Running Tests
Visual inspection is not a substitute for analysis, but it is an essential first pass. Scatter plots, time-series plots, histograms, box plots, and residual plots reveal patterns that a single summary number can conceal.
For example, one high point in a time series may be isolated noise. Several high points after a maintenance event suggest a level shift. On a scatter plot, a supposed outlier may simply belong to a curved relationship that a straight-line model fails to represent.
📊 Use the Mean and Standard Deviation Carefully
For roughly bell-shaped data without strong contamination, analysts often compute a standardized score: z = (x − mean) / standard deviation. A large absolute z-score indicates that a point is far from the sample mean in standard-deviation units.
This approach is useful as a screening device, not an automatic deletion rule. Both the mean and standard deviation are themselves sensitive to extreme values, so a severe outlier can partly hide its own unusualness by changing the reference values.
📦 Understand the Interquartile Range Rule
The interquartile range, or IQR, describes the spread of the middle half of sorted data: IQR = Q3 − Q1. A common box-plot convention flags observations below Q1 − 1.5 × IQR or above Q3 + 1.5 × IQR.
Its strength is robustness: quartiles are less pulled by extreme values than the mean. Its limitation is equally important: the rule flags observations for review; it does not prove measurement error or establish a universal engineering limit.
🛡️ Prefer Robust Summaries When Extremes Matter
The median and IQR can give a more stable description of a dataset with skewness or a few unusual values. Another useful measure is the median absolute deviation, which summarizes typical distance from the median.
Robust statistics do not make outliers disappear. They reduce the chance that a few points dominate the summary, allowing engineers to compare the main pattern and the exceptional observations more clearly.
📐 Look at Residuals, Not Just Raw Values
A residual is the difference between an observed value and the value predicted by a model. In a heat-transfer experiment, a temperature might be high in absolute terms yet perfectly consistent with high input power.
Residual plots ask the better question: given the operating conditions, is this observation unexpectedly different? A pattern of large residuals can expose missing variables, nonlinear behavior, changing variance, or an incorrect model structure.
🧱 Separate Outliers From High-Leverage Points
In regression, a point can be unusual in its input values rather than its output error. Such a point is called a high-leverage point. A test at an exceptionally large load may have little residual but still strongly influence the fitted slope.
Influential observations deserve review because removing or retaining them can materially change a model. Yet they may also be the most valuable data for estimating behavior near the edge of the intended operating range.
🧩 Multivariable Outliers Can Hide in Plain Sight
Many engineering datasets have several variables measured together. A component’s temperature, current, speed, and vibration may each lie within a normal range, while their combination is abnormal.
Multivariate methods compare the joint pattern rather than one column at a time. They can be valuable in condition monitoring, but they require care: correlated variables, limited sample size, and changing operating modes can make a simple distance threshold misleading.
⏱️ Time Order Changes the Meaning
Measurements collected over time are often correlated with earlier measurements. Treating them as independent points can cause normal transients, seasonal cycles, or startup behavior to be mislabeled as outliers.
Engineers should mark known phases such as startup, shutdown, warm-up, cleaning, and fault recovery. A point unusual during stable operation may be entirely expected during a transition.
🌡️ Account for Operating Regimes
A single data distribution may combine several legitimate modes: idle and full-load operation, summer and winter ambient conditions, or two product variants on the same line. One global threshold can incorrectly flag an entire valid subgroup.
Segmenting data by meaningful regime is often better than forcing every observation into one population. The segmentation must be justified by operating knowledge, not invented after seeing an inconvenient result.
🧰 Audit the Instrument and Data Pipeline
When an outlier appears, trace its route from physical event to stored value. Check the sensor condition, calibration record, mounting, wiring, acquisition hardware, communication logs, unit conversions, database transformations, and manual entry steps.
A repeatable fault mechanism is stronger evidence than a statistical label. If a thermocouple intermittently disconnects and produces a recognizable maximum reading, similar records can be flagged using a documented technical reason.
🔁 Replicate When Replication Is Possible
In laboratory work, repeating a measurement under comparable conditions can help distinguish random mishap from reproducible behavior. Replication is not a time machine: it cannot prove whether the original event occurred, but it can test whether the reported mechanism is plausible.
For destructive tests or rare field events, direct repetition may be impossible. Engineers then rely more heavily on instrument checks, independent measurements, event logs, and uncertainty analysis.
🧾 Correct Errors Instead of Silently Deleting Them
If an investigation finds a clear transcription or unit error, correct the value when the original source supports the correction. If the correct value cannot be recovered, exclusion may be appropriate, with the reason retained in the record.
Silent deletion is poor practice because it prevents audit, hides data quality issues, and makes later results impossible to reproduce. Keep the raw data immutable where practical and create an analysis-ready version with documented changes.
🗑️ When Exclusion Is Justified
Removal is most defensible when there is independent evidence that the observation does not represent the quantity of interest. Examples include a confirmed sensor malfunction, a duplicate record, an impossible timestamp, a known failed test setup, or a value from the wrong specimen.
The rationale should state the rule, evidence, affected records, and timing of the decision. A rule created before examining outcomes is generally more credible than one designed to improve a desired result.
✅ When Keeping the Point Is the Better Choice
Keep unusual observations when they are valid and relevant to the question, especially when they reveal loads, failures, or environmental conditions the design must withstand. A real extreme may warrant separate analysis rather than inclusion in a simple average.
For example, a legitimate overload in a fleet dataset should not be erased merely because it is rare. Whether it belongs in a typical-use model, a reliability analysis, or a misuse scenario depends on the decision being supported.
🧮 Compare Results With and Without Questionable Data
A sensitivity analysis shows how conclusions change under reasonable choices. Fit the model with all valid data, then compare it with a version that excludes observations having a documented concern or isolates a separate operating regime.
If the conclusion changes sharply, report that dependence rather than choosing the more convenient result. If the conclusion barely changes, the decision may be less consequential, though the data-quality issue still deserves documentation.
🧑🔧 Use Domain Experts Without Handing Over the Decision
Technicians, operators, and subject-matter engineers often know whether a strange reading coincides with a real event: a valve cycling, a power interruption, an unusual material batch, or a test-rig limitation.
Domain knowledge should inform the investigation, while the evidence remains visible. “An experienced operator said it looked wrong” is a useful lead, not by itself a complete data-exclusion criterion.
🤖 Outliers in Machine Learning Need Extra Care
Machine-learning models can overfit unusual records, especially when datasets are small. At the same time, anomaly-detection systems are often built specifically to identify rare behavior, so removing those examples can weaken the very capability being developed.
Labels deserve scrutiny too. A record labeled “fault” may be a data-entry mistake; a rare but valid operating condition may be mislabeled as faulty. Split data carefully to avoid leaking duplicate or time-adjacent records between training and evaluation.
⚠️ Safety-Critical Data Demand a Conservative Mindset
For bridges, aircraft, medical devices, pressure systems, and other safety-critical applications, extreme observations may carry disproportionate significance. Engineering judgment should consider measurement uncertainty, failure consequences, and applicable project procedures or standards.
Statistics can prioritize questions, but they cannot certify safety on their own. Escalate unresolved anomalies when they may indicate damage, hazardous operation, or a limitation in the evidence supporting a decision.
🚫 Common Mistakes That Produce Misleading Results
- Deleting points to improve a fit: a higher correlation coefficient does not validate the removal.
- Using one threshold for every dataset: distribution shape, operating regime, and measurement uncertainty differ.
- Confusing rarity with error: rare events can be central to risk assessment.
- Ignoring clustered anomalies: several “outliers” may be a new process state.
- Reporting only cleaned results: readers need to know what was excluded and why.
These errors are avoidable when outlier handling is planned as part of the analysis rather than improvised at the end.
🧭 A Practical Investigation Workflow
- Define the engineering question and the population or operating regime of interest.
- Preserve raw data and inspect plots, metadata, and data-collection logs.
- Use statistical flags to identify records for review, not to make automatic judgments.
- Check physical plausibility, instrument behavior, units, and related measurements.
- Classify the record: error, valid rare event, different regime, or unresolved.
- Correct, retain, separate, or exclude it with a written rationale.
- Assess sensitivity and report how the decision affects the conclusion.
This workflow is deliberately slower than pressing a “remove outliers” button. It is also more likely to produce analyses that others can inspect and trust.
📋 Document Decisions So Others Can Reproduce Them
A concise outlier log can record the observation identifier, flagging method, investigation evidence, final treatment, responsible reviewer, and impact on results. This is useful in student projects and essential in collaborative professional work.
Good documentation does not imply uncertainty was eliminated. It shows that uncertainty was recognized, investigated, and communicated honestly.
🧠 The Core Principle: Investigate Before You Exclude
Outlier handling is not a contest between statistics and engineering intuition. Statistical tools identify observations worth attention; physical knowledge, measurement evidence, and the intended decision determine what those observations mean.
The strongest analysis makes unusual data visible, explains the treatment chosen, and shows whether conclusions depend on it. A clean dataset is not necessarily a trustworthy dataset; a well-understood dataset is the real goal.
Engineers should remove data only when there is evidence it does not represent the question being asked, and keep or separately analyze unusual data when it reveals real system behavior. That habit protects both analytical integrity and practical judgment. 📐🔎🛠️